Ichie Hara's Profile

Number of items: 13
Date joined: Dec 11 2017
Ichie Hara's Work
#1
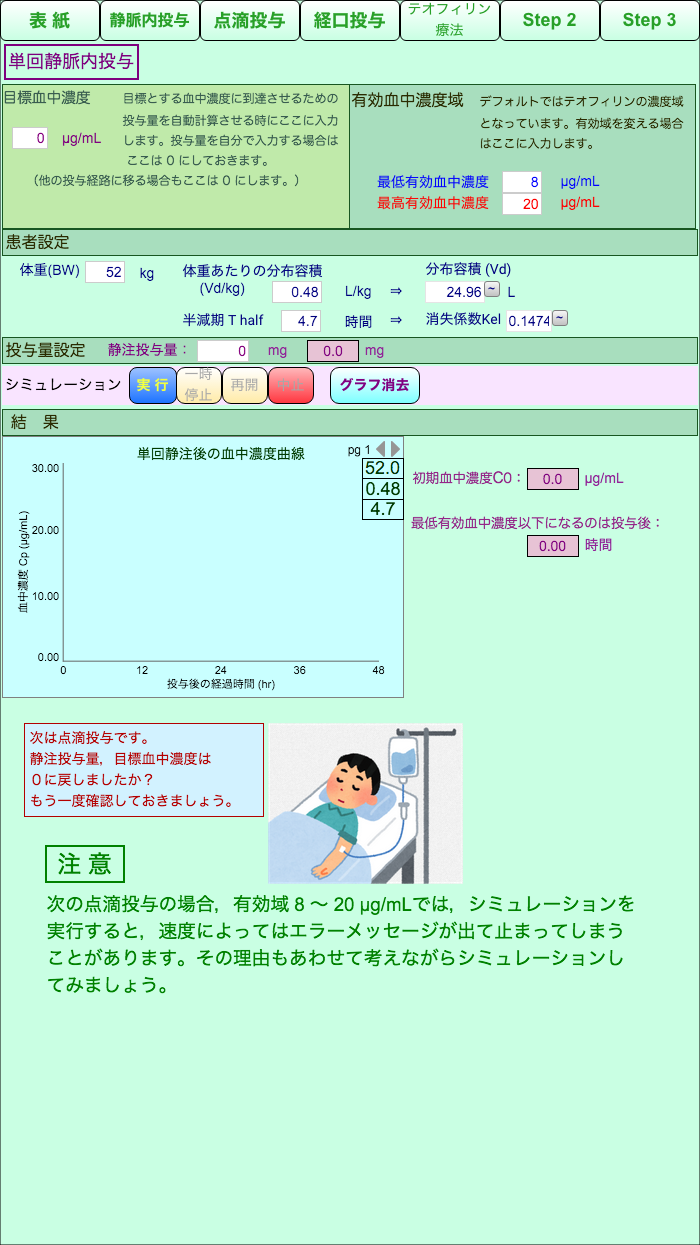
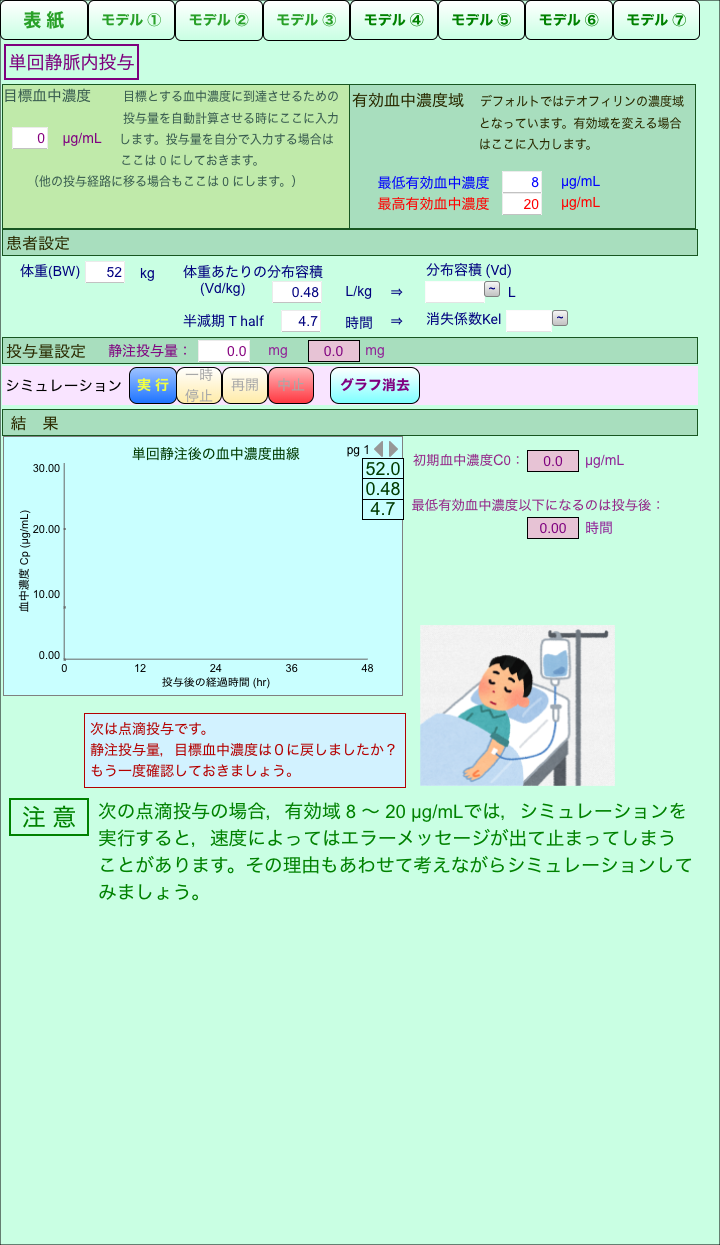
2019 Step1
Step1
sim
⋮ 36404 runs
intravenous
oral
theophylline
#2
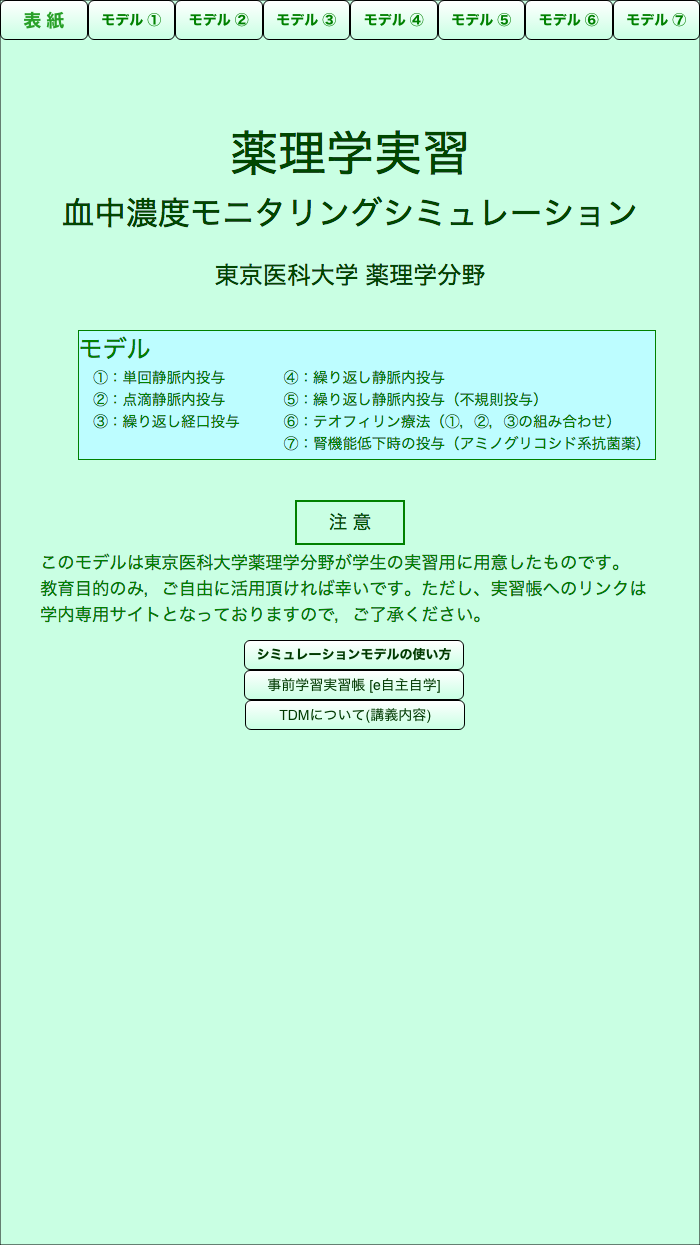
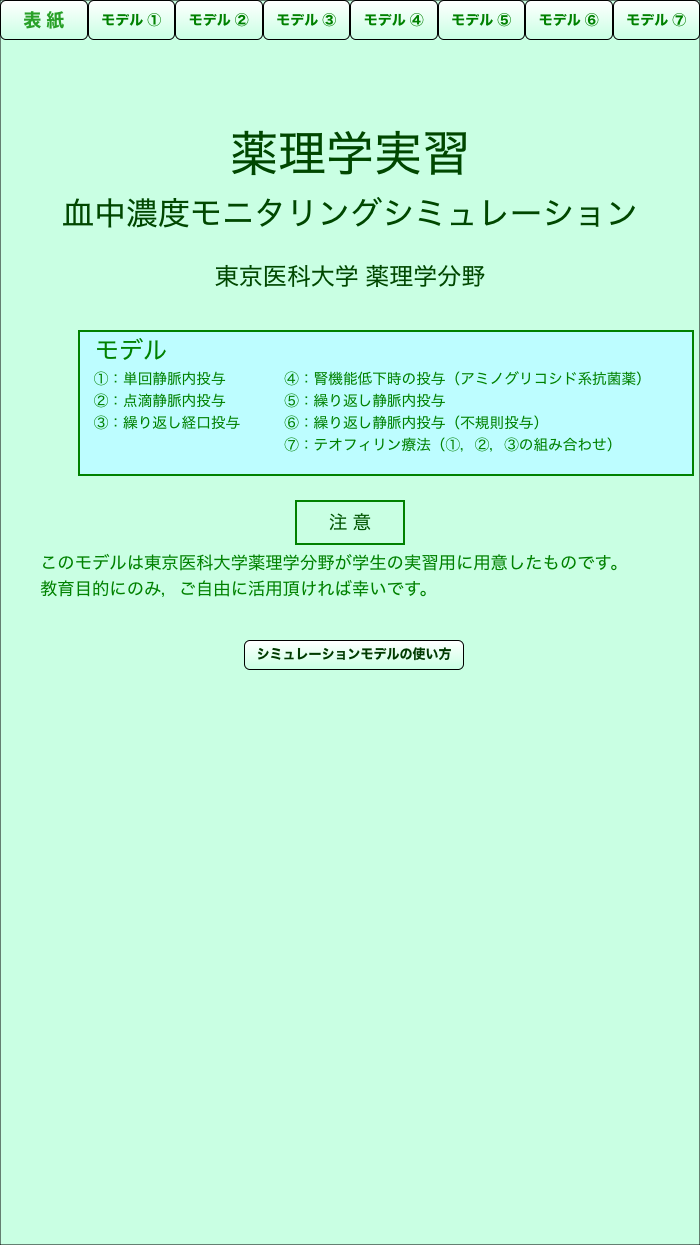
Toppage
sim
⋮ 20 runs
tokyo medical
TMU
pharmacokinetic
Hara
#3
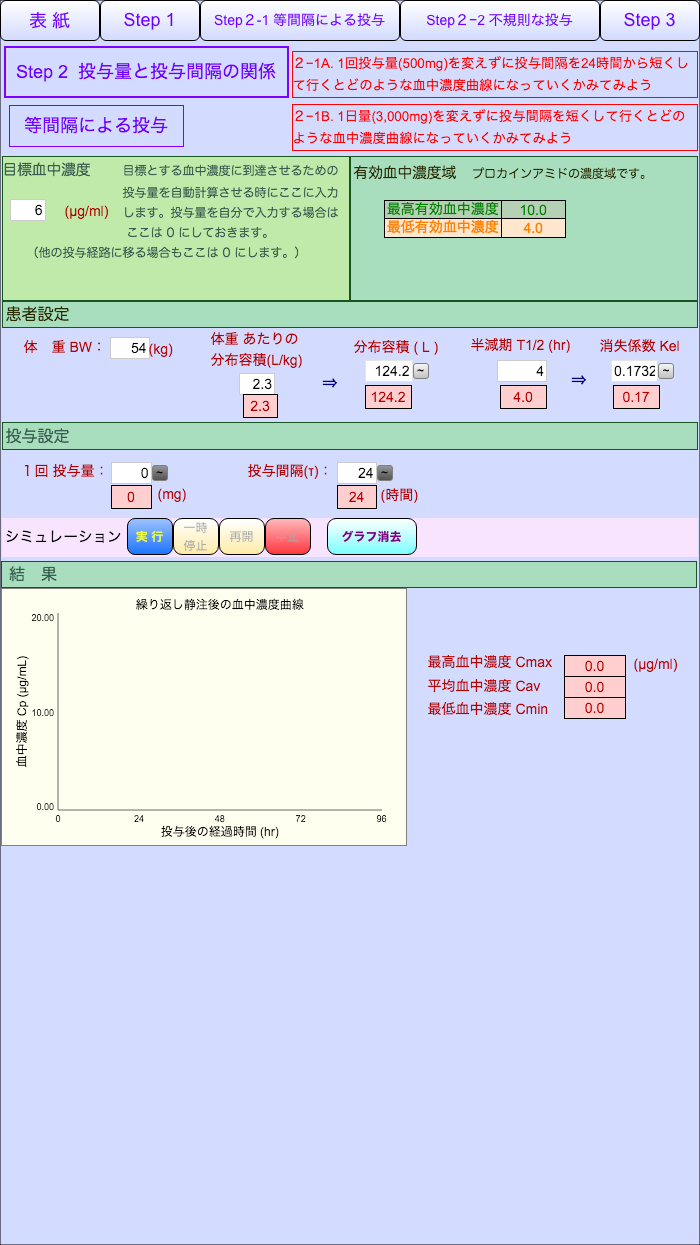
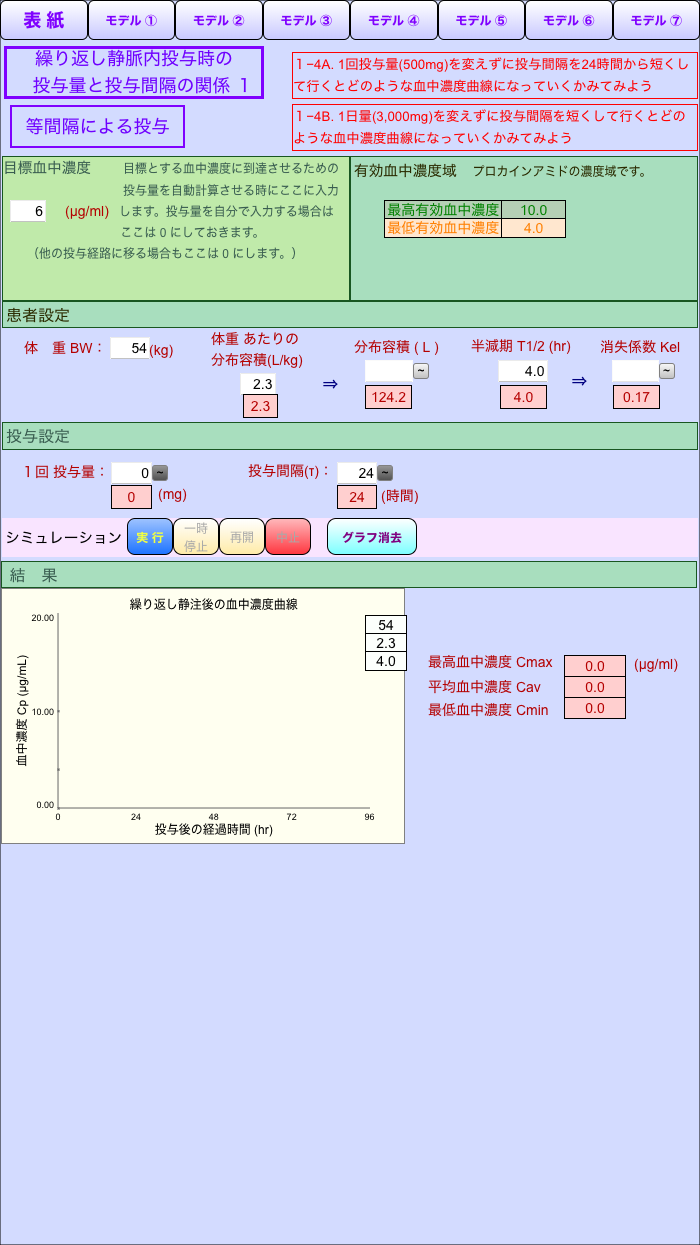
2019 Step2
dosing interval
sim
⋮ 9368 runs
regular
irregular
#4
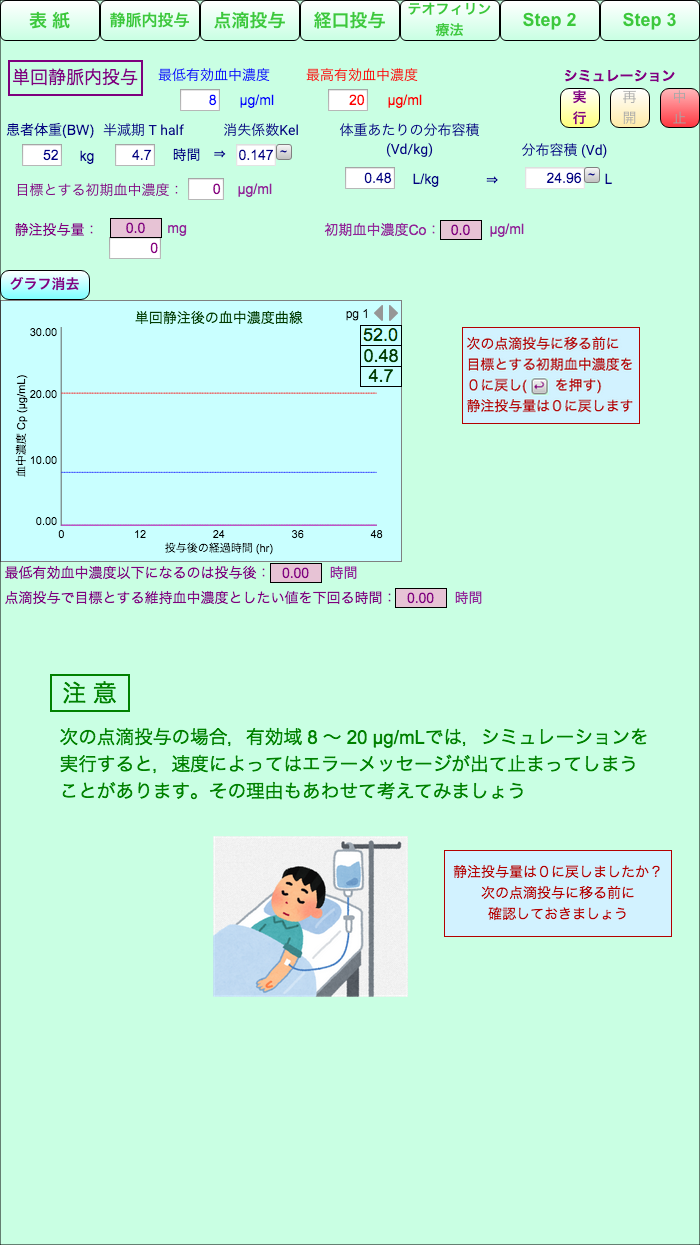
2019 Step3 renew
sim
⋮ 19277 runs
#5

Internet Speed
Average
sim
#6
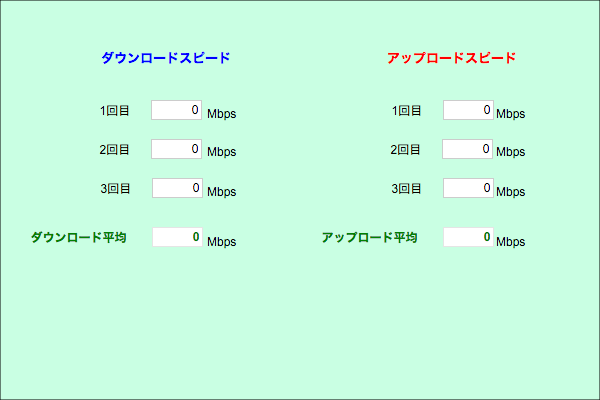
Speed
average
sim
⋮ 3 runs
#7
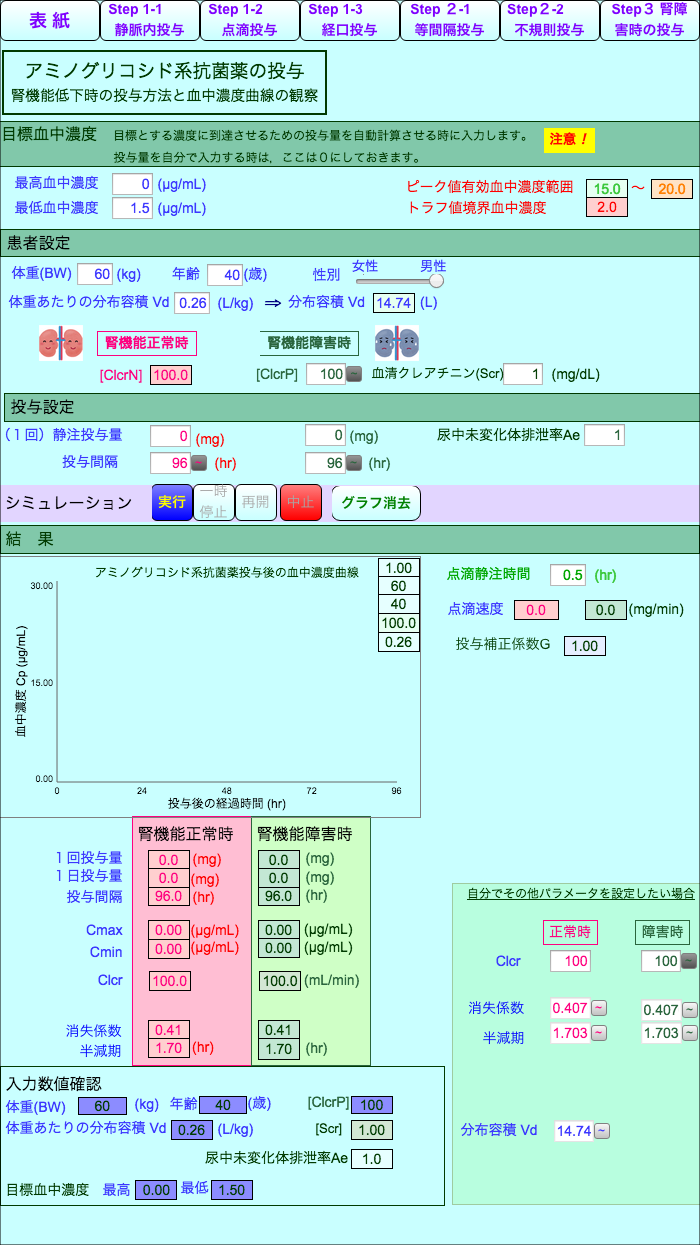
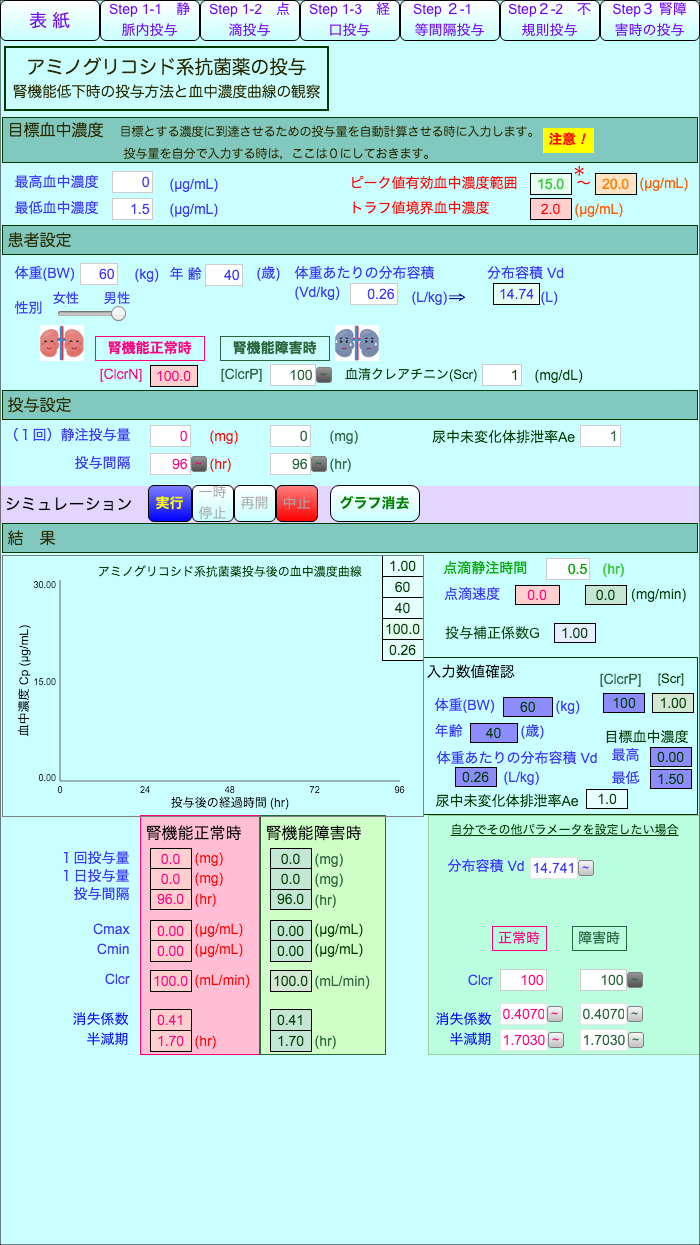
Dosing regimen for renal failure
compare plasma concentration in renal failure, plan the dosing regimen in renal failure
sim
⋮ 3584 runs
Pharmacokinetics
creatinine clearance
Scr
Clcr
aminoglycoside
#8
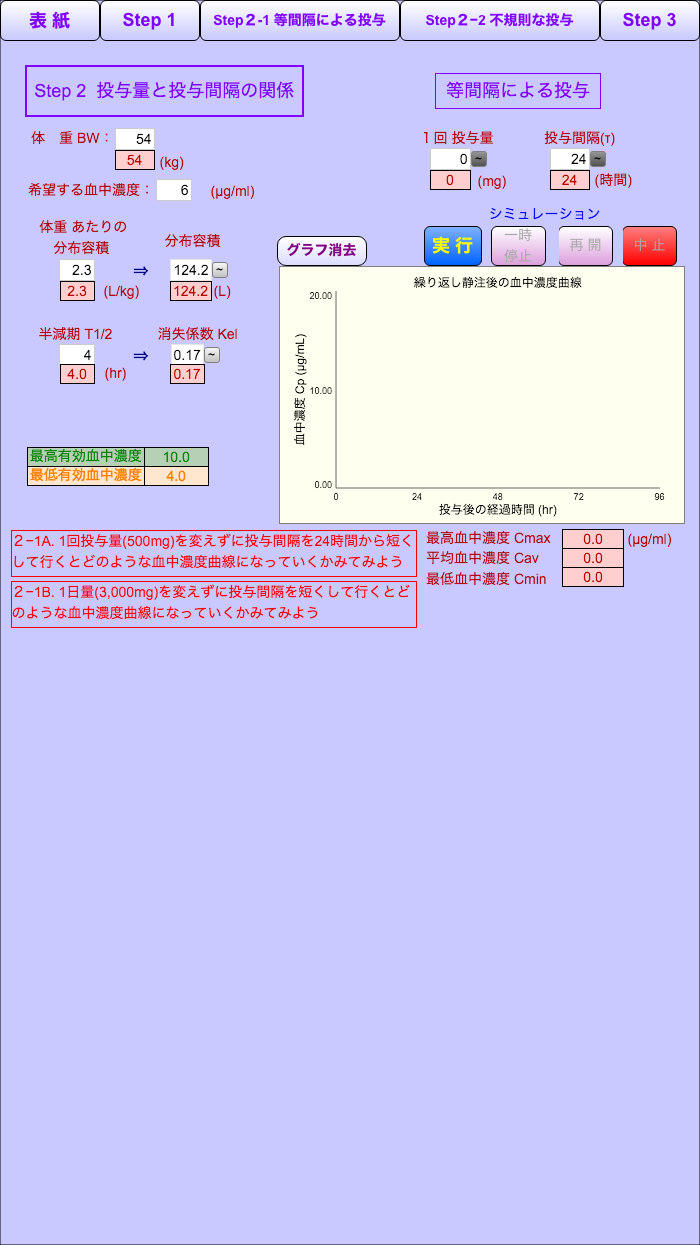
Change the dosing interval
interval & dosing, regularly or irregularly
sim
⋮ 2922 runs
Pharmacokinetics
dosing interval
irregular interval
TMU
Hara
#9
Index21
2021 Index
sim
⋮ 1 run
Biology
Science
Education
pharmacokinetics
simulation
#10
Administration routes
observe three type of plasma concentration curve, and combine three of them
sim
⋮ 10834 runs
Pharmacokinetics
intra venous
bolus
div
p.o.
#11

Dosing regimen for renal failure
Dosing regimen for renal failure
sim
⋮ 30435 runs
Biology
Science
Education
pharmacokinetics
simulation
#12
interval
dosing interval
sim
⋮ 24435 runs
Biology
Science
Education
pharmacokinetics
simulation
#13
Route21
Administration routes
sim
⋮ 82321 runs
Biology
Science
Education
pharmacokinetics
simulation
Uploading a Bundle from Zip
Instead of creating bundles, categories, and assemblies one by one, you can upload a single zip file that contains all of your bundle's content. To create your zipped bundle, make a folder with your bundle's name and add subfolders with your categories' names. The folder tree should have the same structure that you want the categories to have in your bundle. Place your assembly .stmx files in the appropriate category folders, then zip your bundle folder and upload it using the Upload Bundle from Zip link above.
Assemblies, Bundles, and Categories
Assemblies are self contained models that demonstrate common ways to connect together building blocks and that can be used as parts of other models. This is analogous to using prefabricated wall and roof pieces to construct a house.
Bundles are groups of assemblies with a common use or theme. For example, a Health Care bundle might contain a variety of assemblies that aid in creating health care models. When you download assemblies from the isee Exchange™, you download an entire bundle, rather than individual assemblies.
Categories are subgroups of assemblies within a bundle. For example, a Health Care bundle might contain a Funding category for assemblies related to the management of hospital funds. All assemblies must be assigned to a category—they cannot be assigned to the root of a bundle.
Assemblies, bundles, and categories can be created and uploaded to the isee Exchange™ via the options on the Manage My Assemblies page. To learn more, visit our help pages, or take our assemblies tutorial.
Sim App (Sim)
An interface that allows users to interact with a model.
Sim apps allow users to interact with a model using buttons, sliders, knobs, tables, graphs, and storytelling. These interactions help users understand how parts of a system interact.
Interfaces are created by model authors in the Stella desktop software and can be uploaded to the isee Exchange™.
Model
A diagram that represents how elements in a system influence one another.
Models are mathematical representations of how elements in a system are connected and interact (e.g., ecosystems, organizations, supply chains). When running models on the isee Exchange™, results can be viewed in output devices like graphs and tables.
Models appear in the isee Exchange™ directory when authors upload them from the Stella® desktop software or create them with Stella Online™.
Causal Loop Diagram (CLD)
A map that represents the feedback structure of a system.

CLDs are high-level maps that represents the feedback structure of a system and easily communicate the essence of a model. They appear in the isee Exchange™ when authors upload them from the Stella desktop software or create them with Stella Online™.