MEENA123's Profile

Number of items: 6
Date joined: Oct 23 2023
MEENA123's Work
#1
URBAN SUSTANABLITY
The third and last group of main feedback loops concerns the topic of “land
availability”. Cities c
... Read more
The third and last group of main feedback loops concerns the topic of “land
availability”. Cities cannot indeed grow indefinitely; above all, it is important to
dedicate some space for green areas and parking lots, which complete the viability of
the city.
The loops belonging to the third group are balancing loops which limit
#2
URBAN SUSTANABLITY
URBAN SUSTANABLITY
#3
#4
#5
URBAN SUSTANABLITY
The Causal Loop Diagram (CLD) developed for the SUSTAIN model is composed
by different variables, t
... Read more
The Causal Loop Diagram (CLD) developed for the SUSTAIN model is composed
by different variables, that represent areas of interest in a general modern urban
system at the same time giving emphasis to management issues related to more
specific areas/sectors of an urban environment. Stated differently, the model includes
both sectors devoted to specific areas of a modern urban environment (e.g., environment, transport, urban planning, waste and water management) and a core sector
where “common” variables (e.g., GDP and population) are included and are affected
by the decisions taken in other areas of the model.
As the CLD (and the subsequently developed Stock and Flow Diagram) was the
basis for the development of the rules and elements of the boardgame (which is one
of the main outcomes of the SUSTAIN project), the core of the model revolves
around one of the most important parameters for deciding who will win the game,
i.e. the Attractiveness of the city. This variable is the synthesis of multiple variables
that belong to many aspects of the urban system, defining the “wellbeing” of the
population who lives in it.
The most important effect due to variations in the Attractiveness of the city is a
variation of the number of people who live there; this generates many impacts on
different urban levels, triggering in turn a certain number of feedback loops. In fact,
most of the feedback loops we identified “pass” through the Population variable. It is
kind of natural that this happens as, in the end, urban systems exist because of its
inhabitants, indeed.
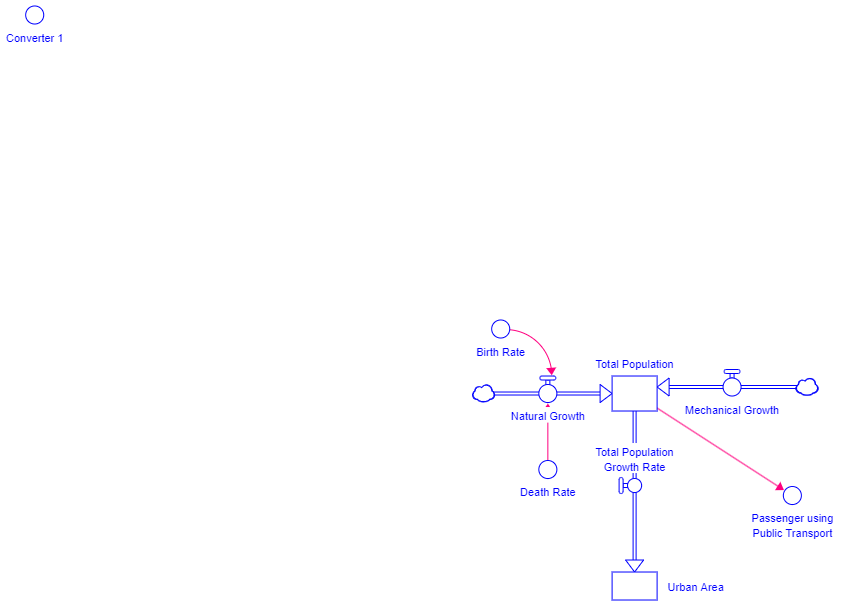
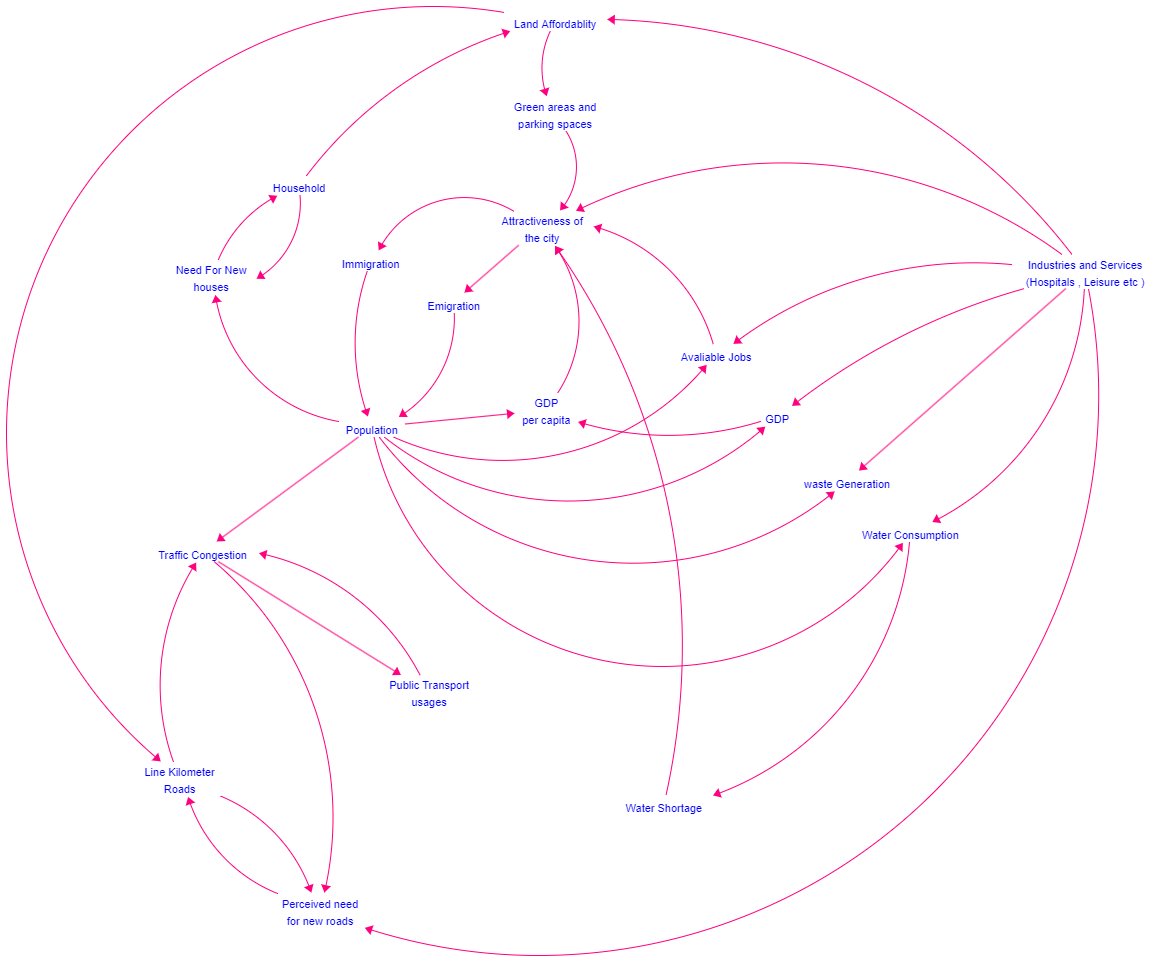
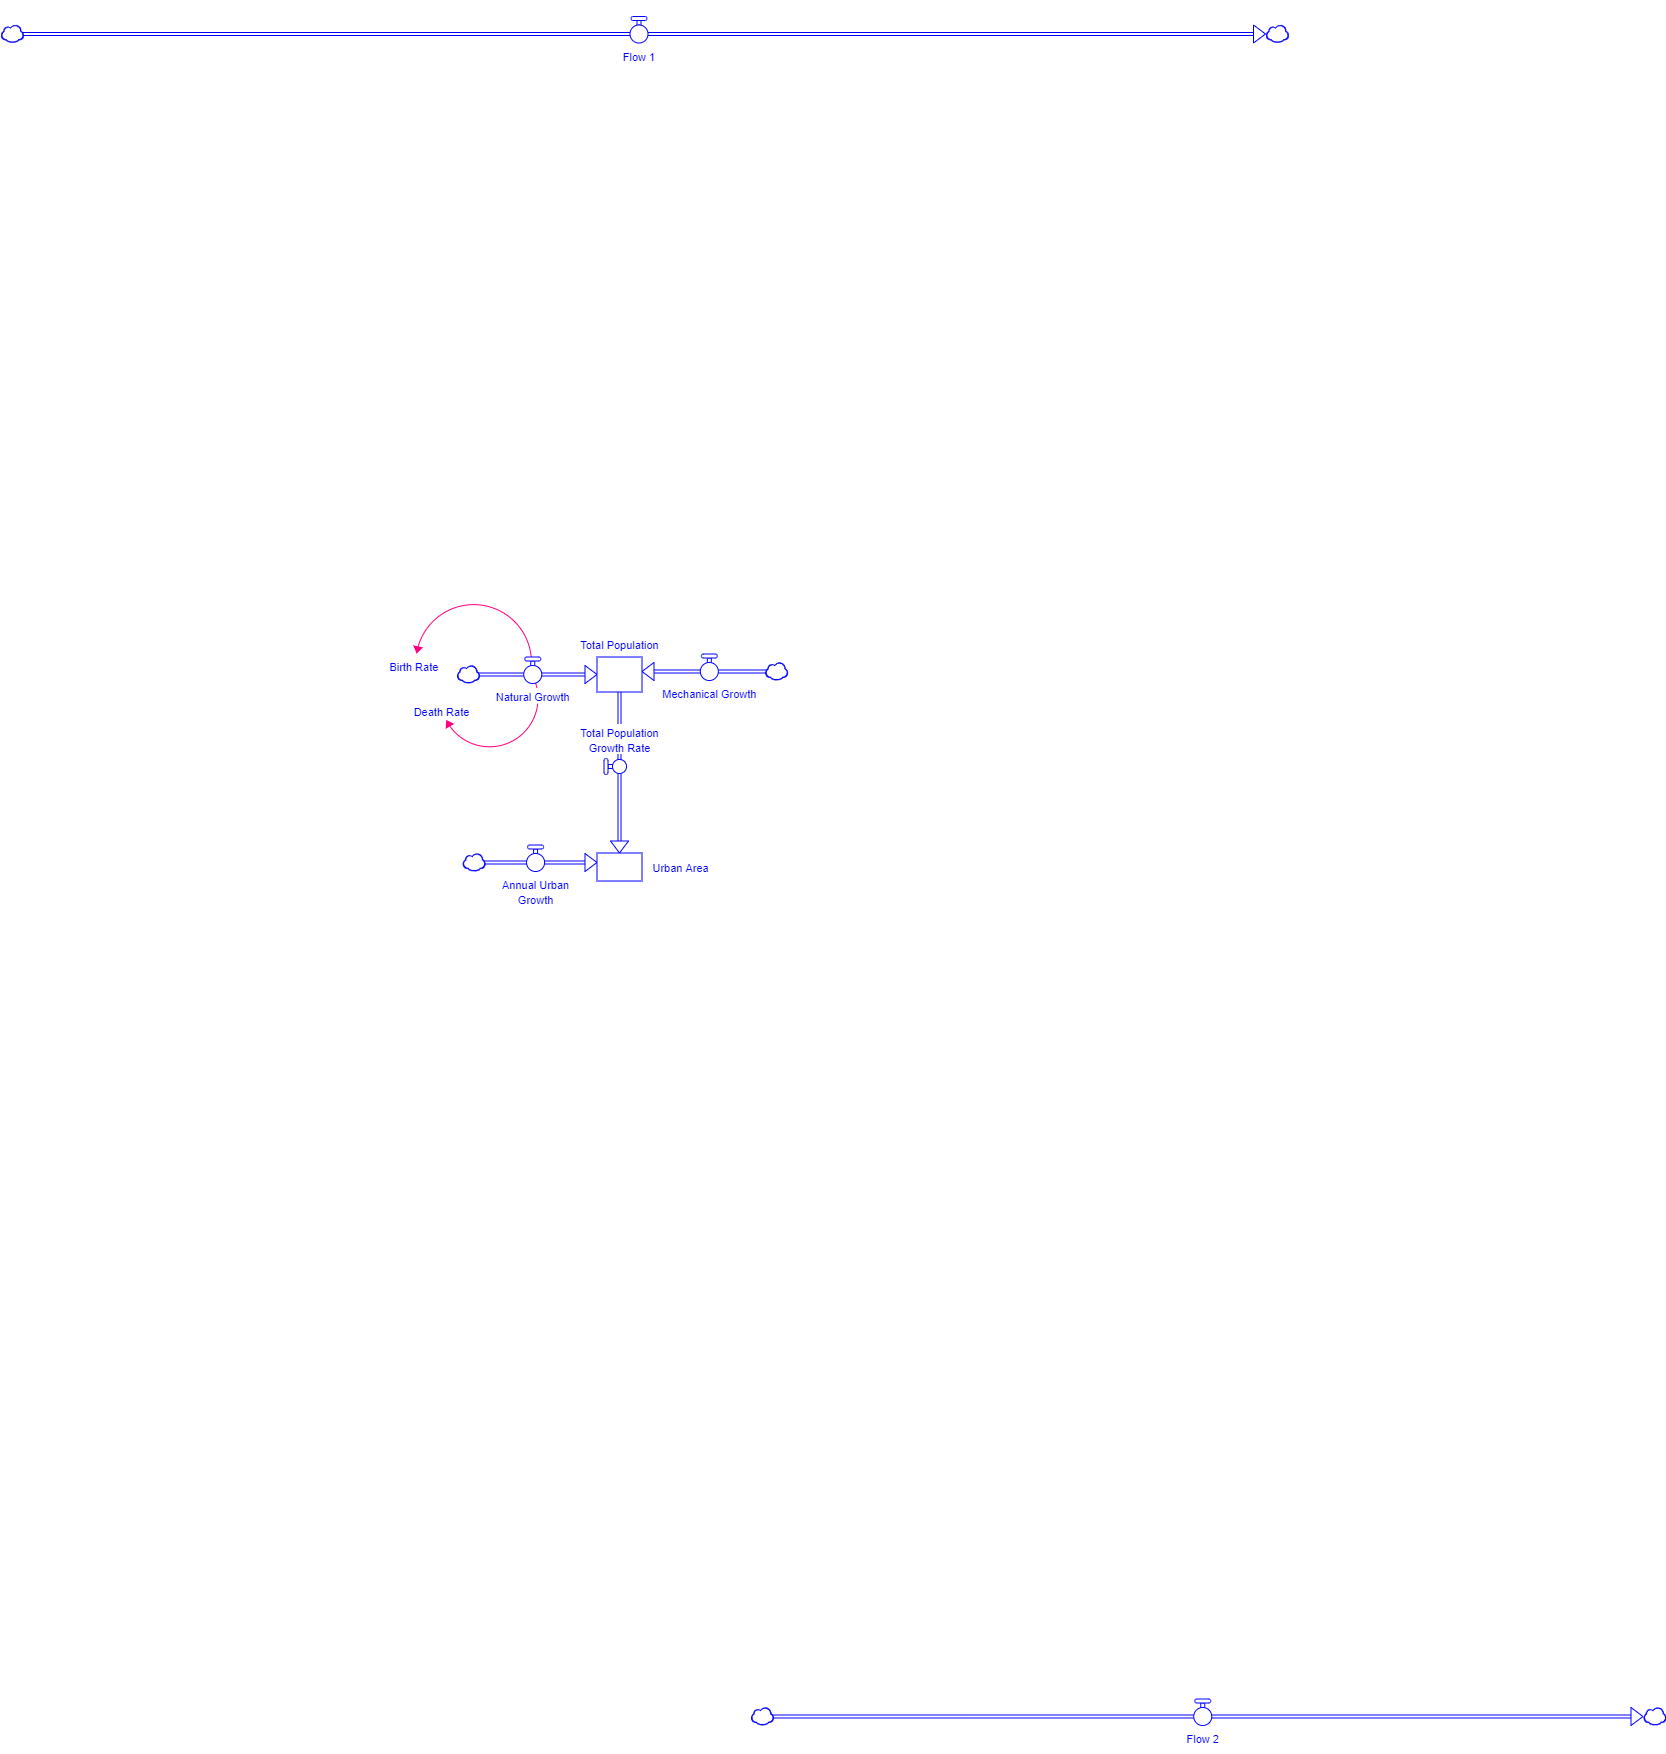
Analysing the CLD (see Fig. 4.4), the most important feedback loops were
identified and then divided into three main groups.
The first group is composed of loops belonging to the “core” of the model, that is
constituted by the relation between population, GDP and Industries and Services
(Fig. 4.5).
The first two reinforcing feedback loops (R1 and R2) trigger when a variation in
the Attractiveness of the city causes an increase in Population, which generally has a
positive effect on the GDP: the more the GDP, the more the development of
industries and services. This generates a twofold positive effect on attractiveness:
on one hand, there is the availability of more services and developed industries; on
the other hand, more services and industries lead to more jobs for inhabitants. The
former phenomenon is limited by a balancing feedback loop (B1), which depicts the
saturation of jobs in the city. Finally, GDP and Industries and Services are tied
together by a simple reinforcing feedback loop (R3).
The second group is composed by loops which belong to the “environmental”
part of the model. Water, waste and transport have direct impacts on the total
pollution and, in turn, on the Attractiveness of the city.
As opposed to the reinforcing loops previously described, there are two balancing
loops (B2 and B3) that tend to stabilize the Attractiveness of the city through the possible increase in population, which in turn causes an increase in waste generation
and water consumption, with consequences on pollution and water shortage.
Another reinforcing feedback (R4) describes how traffic congestion influences
the usage of public transport and, in turn, how it impacts pollution. This loop is
balanced by two loops (B4 and B5): on one hand, the usage of public transport
naturally reduces the problem of traffic congestion; on the other hand, external
policies could increase the roads’ capacity and length addressing the same problem
The third and last group of main feedback loops concerns the topic of “land
availability”. Cities cannot indeed grow indefinitely; above all, it is important to
dedicate some space for green areas and parking lots, which complete the viability of
the city.
The loops belonging to the third group are balancing loops which limit
#6
Uploading a Bundle from Zip
Instead of creating bundles, categories, and assemblies one by one, you can upload a single zip file that contains all of your bundle's content. To create your zipped bundle, make a folder with your bundle's name and add subfolders with your categories' names. The folder tree should have the same structure that you want the categories to have in your bundle. Place your assembly .stmx files in the appropriate category folders, then zip your bundle folder and upload it using the Upload Bundle from Zip link above.
Assemblies, Bundles, and Categories
Assemblies are self contained models that demonstrate common ways to connect together building blocks and that can be used as parts of other models. This is analogous to using prefabricated wall and roof pieces to construct a house.
Bundles are groups of assemblies with a common use or theme. For example, a Health Care bundle might contain a variety of assemblies that aid in creating health care models. When you download assemblies from the isee Exchange™, you download an entire bundle, rather than individual assemblies.
Categories are subgroups of assemblies within a bundle. For example, a Health Care bundle might contain a Funding category for assemblies related to the management of hospital funds. All assemblies must be assigned to a category—they cannot be assigned to the root of a bundle.
Assemblies, bundles, and categories can be created and uploaded to the isee Exchange™ via the options on the Manage My Assemblies page. To learn more, visit our help pages, or take our assemblies tutorial.
Sim App (Sim)
An interface that allows users to interact with a model.
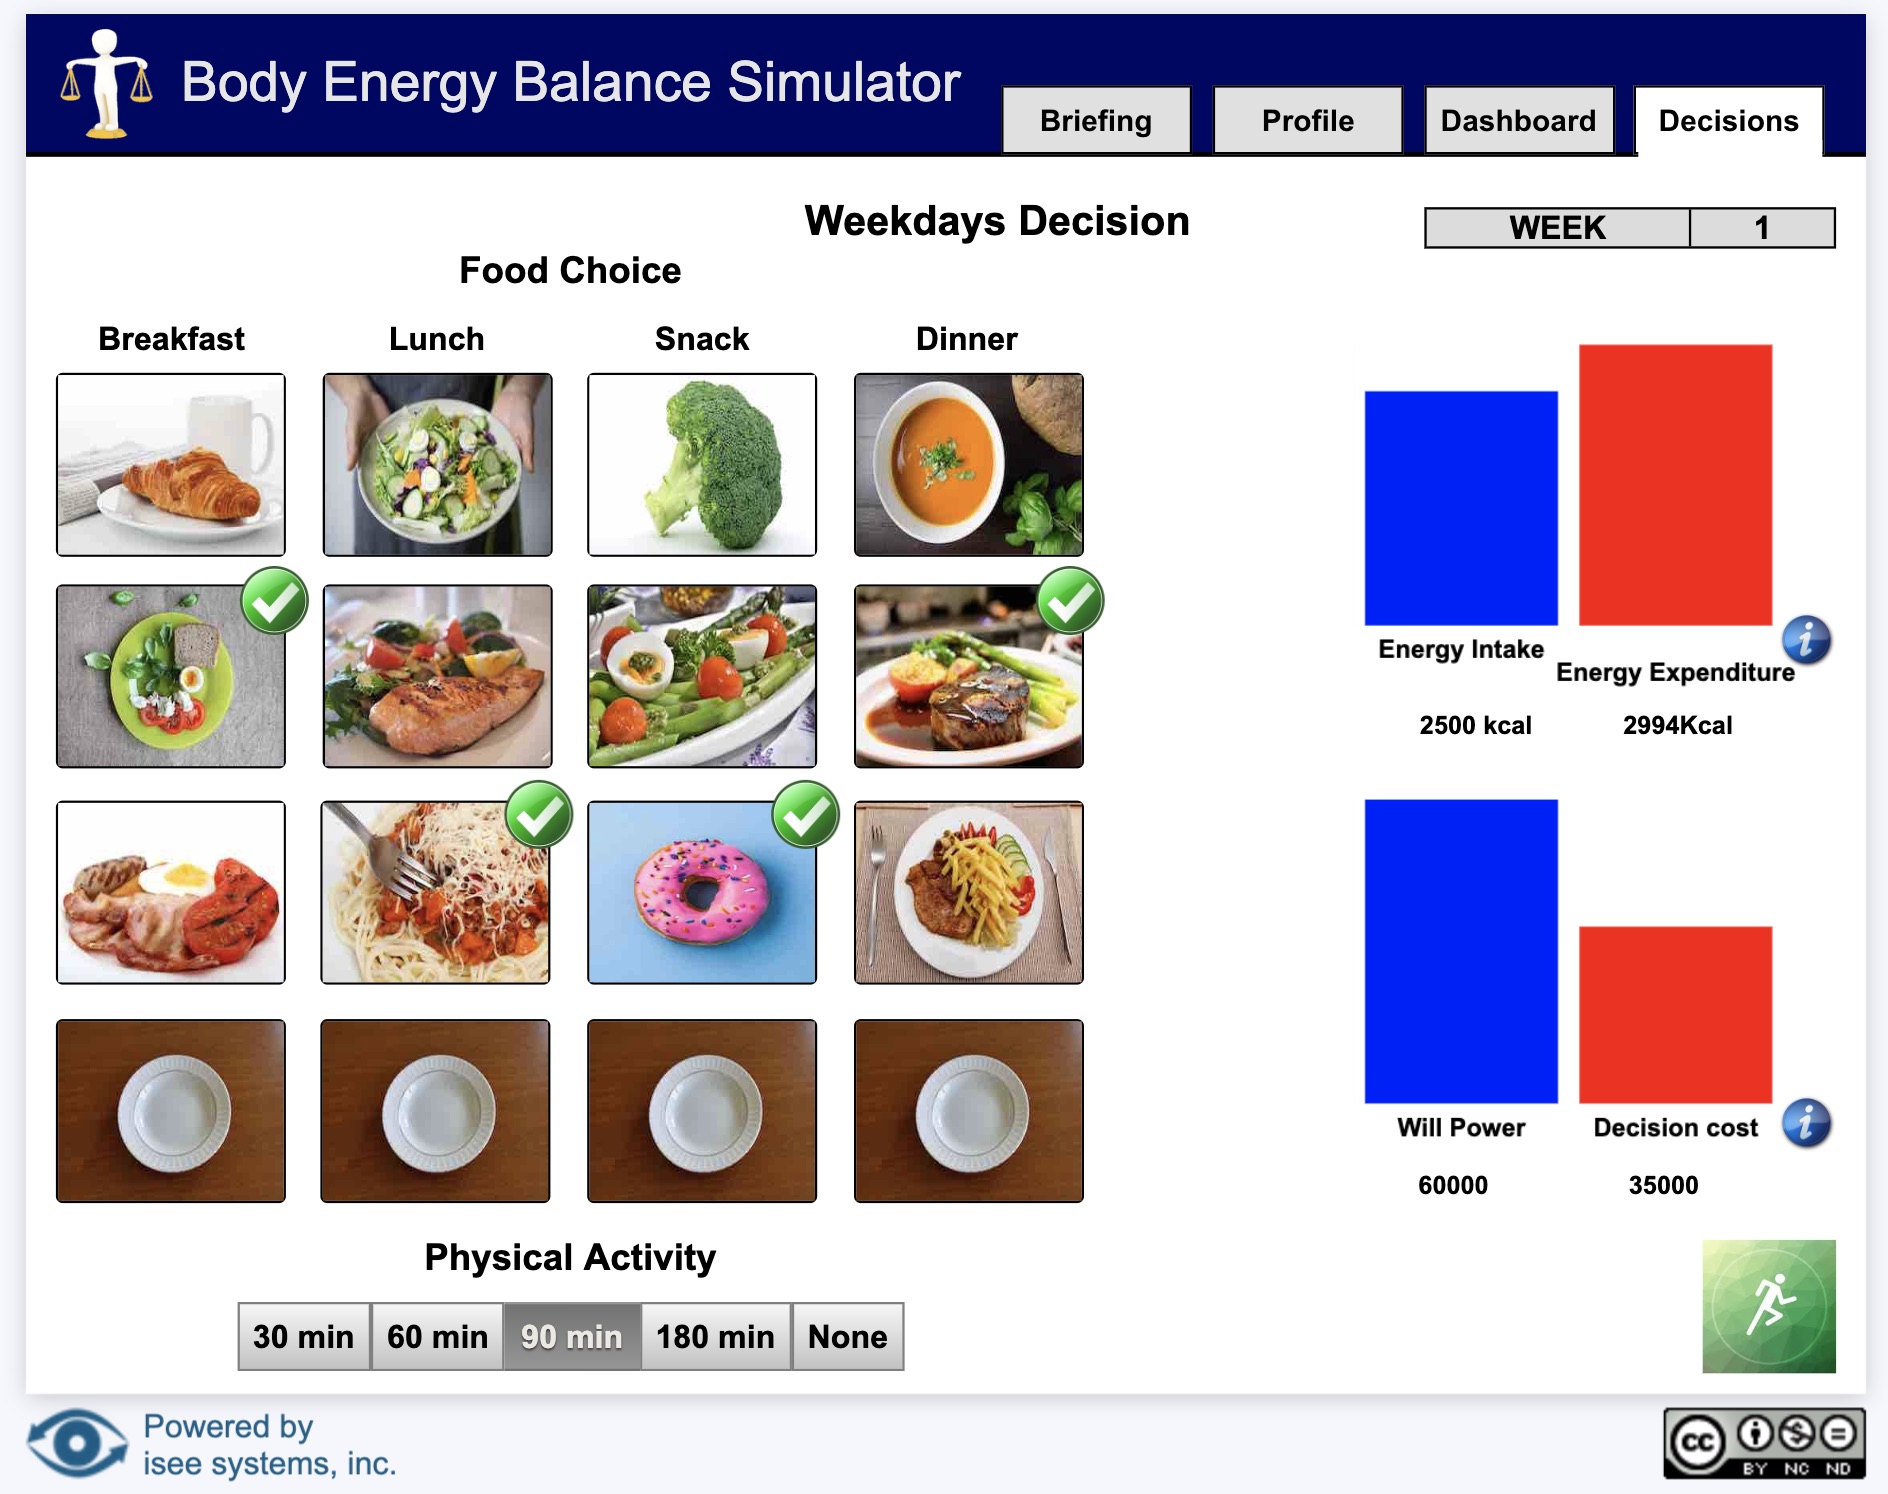
Sim apps allow users to interact with a model using buttons, sliders, knobs, tables, graphs, and storytelling. These interactions help users understand how parts of a system interact.
Interfaces are created by model authors in the Stella desktop software and can be uploaded to the isee Exchange™.
Model
A diagram that represents how elements in a system influence one another.
Models are mathematical representations of how elements in a system are connected and interact (e.g., ecosystems, organizations, supply chains). When running models on the isee Exchange™, results can be viewed in output devices like graphs and tables.
Models appear in the isee Exchange™ directory when authors upload them from the Stella® desktop software or create them with Stella Online™.
Causal Loop Diagram (CLD)
A map that represents the feedback structure of a system.

CLDs are high-level maps that represents the feedback structure of a system and easily communicate the essence of a model. They appear in the isee Exchange™ when authors upload them from the Stella desktop software or create them with Stella Online™.