profile image
Number of items: 1
Date joined: Jul 04 2024

Divya Sasi Latha's Work

#1

Supply Chain 4.0 Framework

### Key Variables for Visualization of Relationships in Supply Chain 4.0 using CLDs #### Introduc ... Read more
### Key Variables for Visualization of Relationships in Supply Chain 4.0 using CLDs #### Introduction Causal Loop Diagrams (CLDs) are valuable tools for visualizing the cause-and-effect relationships between different elements of the supply chain. Identifying the key variables involved in these relationships is essential for understanding and managing the complexities of Supply Chain 4.0. Below are the key variables that should be considered for creating effective CLDs in the context of the food industry supply chain. #### Key Variables 1. **Supply Chain Visibility** - Real-time data availability - Monitoring and tracking systems 2. **Inventory Levels** - Raw materials inventory - Work-in-progress (WIP) inventory - Finished goods inventory 3. **Demand Forecasting** - Accuracy of demand predictions - Variability in consumer demand 4. **Production Efficiency** - Production throughput - Equipment uptime and downtime - Automation levels 5. **Quality Control** - Defect rates - Inspection and testing frequency - Quality assurance processes 6. **Transportation and Logistics** - Transportation times - Fleet utilization rates - Route optimization 7. **Supplier Reliability** - On-time delivery rates - Supplier lead times - Supplier quality performance 8. **Customer Satisfaction** - Order fulfillment rates - Customer feedback and complaints - Product return rates 9. **Risk Management** - Identification of potential risks - Mitigation strategies in place - Risk monitoring and reporting 10. **Cybersecurity Measures** - Incidence of cyber-attacks - Effectiveness of security protocols - Data breach recovery times 11. **Data Integrity** - Accuracy of sensor data - Data validation processes - Error rates in data transmission 12. **Operational Costs** - Production costs - Transportation and logistics costs - Inventory holding costs 13. **Sustainability Practices** - Waste reduction rates - Energy consumption levels - Use of sustainable materials 14. **Compliance with Regulations** - Adherence to food safety standards - Compliance with environmental regulations - Implementation of regulatory changes 15. **Technology Integration** - Deployment of IoT and IoRT devices - Integration with existing systems - Technology adoption rates 16. **System Flexibility and Adaptability** - Ability to respond to demand changes - Flexibility in production processes - Scalability of supply chain operations #### Example CLD Relationships - **Inventory Levels and Production Efficiency**: - Higher inventory levels of raw materials can lead to increased production efficiency due to reduced delays in the supply chain. - However, excessive inventory can increase holding costs, affecting overall operational costs. - **Demand Forecasting and Customer Satisfaction**: - Accurate demand forecasting improves order fulfillment rates, enhancing customer satisfaction. - Inaccurate forecasts can lead to stockouts or overstock situations, negatively impacting customer satisfaction. - **Transportation and Supplier Reliability**: - Reliable suppliers ensure timely delivery of raw materials, reducing transportation times and improving overall logistics efficiency. - Delays in transportation can disrupt production schedules and lead to increased operational costs. - **Quality Control and Customer Satisfaction**: - Stringent quality control processes reduce defect rates and product returns, leading to higher customer satisfaction. - Poor quality control can result in increased defects, affecting brand reputation and customer trust. - **Cybersecurity Measures and Data Integrity**: - Robust cybersecurity measures protect data integrity, ensuring accurate and reliable information for decision-making. - Data breaches can compromise data integrity, leading to poor decisions and potential disruptions in the supply chain. - **Operational Costs and Sustainability Practices**: - Implementing sustainability practices such as waste reduction can lower operational costs in the long term. - Initial investments in sustainable technologies may increase costs but lead to long-term savings and compliance with regulations. - **Technology Integration and System Flexibility**: - Effective integration of IoT and IoRT devices enhances system flexibility and adaptability to changing conditions. - Poor integration can create bottlenecks and reduce the overall efficiency of the supply chain. #### Conclusion By identifying and understanding these key variables, supply chain managers can use CLDs to visualize the complex interactions within their operations. This approach helps in predicting potential outcomes, identifying leverage points for intervention, and developing strategies to enhance trustworthiness and resilience in Supply Chain 4.0.
model74 downloads
Download Model
A Framework for Trustworthiness and Resilience in Supply Chain 4.0
X

Uploading a Bundle from Zip

Instead of creating bundles, categories, and assemblies one by one, you can upload a single zip file that contains all of your bundle's content. To create your zipped bundle, make a folder with your bundle's name and add subfolders with your categories' names. The folder tree should have the same structure that you want the categories to have in your bundle. Place your assembly .stmx files in the appropriate category folders, then zip your bundle folder and upload it using the Upload Bundle from Zip link above.

Assemblies, Bundles, and Categories

Assemblies are self contained models that demonstrate common ways to connect together building blocks and that can be used as parts of other models. This is analogous to using prefabricated wall and roof pieces to construct a house.

Bundles are groups of assemblies with a common use or theme. For example, a Health Care bundle might contain a variety of assemblies that aid in creating health care models. When you download assemblies from the isee Exchange™, you download an entire bundle, rather than individual assemblies.

Categories are subgroups of assemblies within a bundle. For example, a Health Care bundle might contain a Funding category for assemblies related to the management of hospital funds. All assemblies must be assigned to a category—they cannot be assigned to the root of a bundle.

Assemblies, bundles, and categories can be created and uploaded to the isee Exchange™ via the options on the Manage My Assemblies page. To learn more, visit our help pages, or take our assemblies tutorial.

Sim App (Sim)

An interface that allows users to interact with a model.
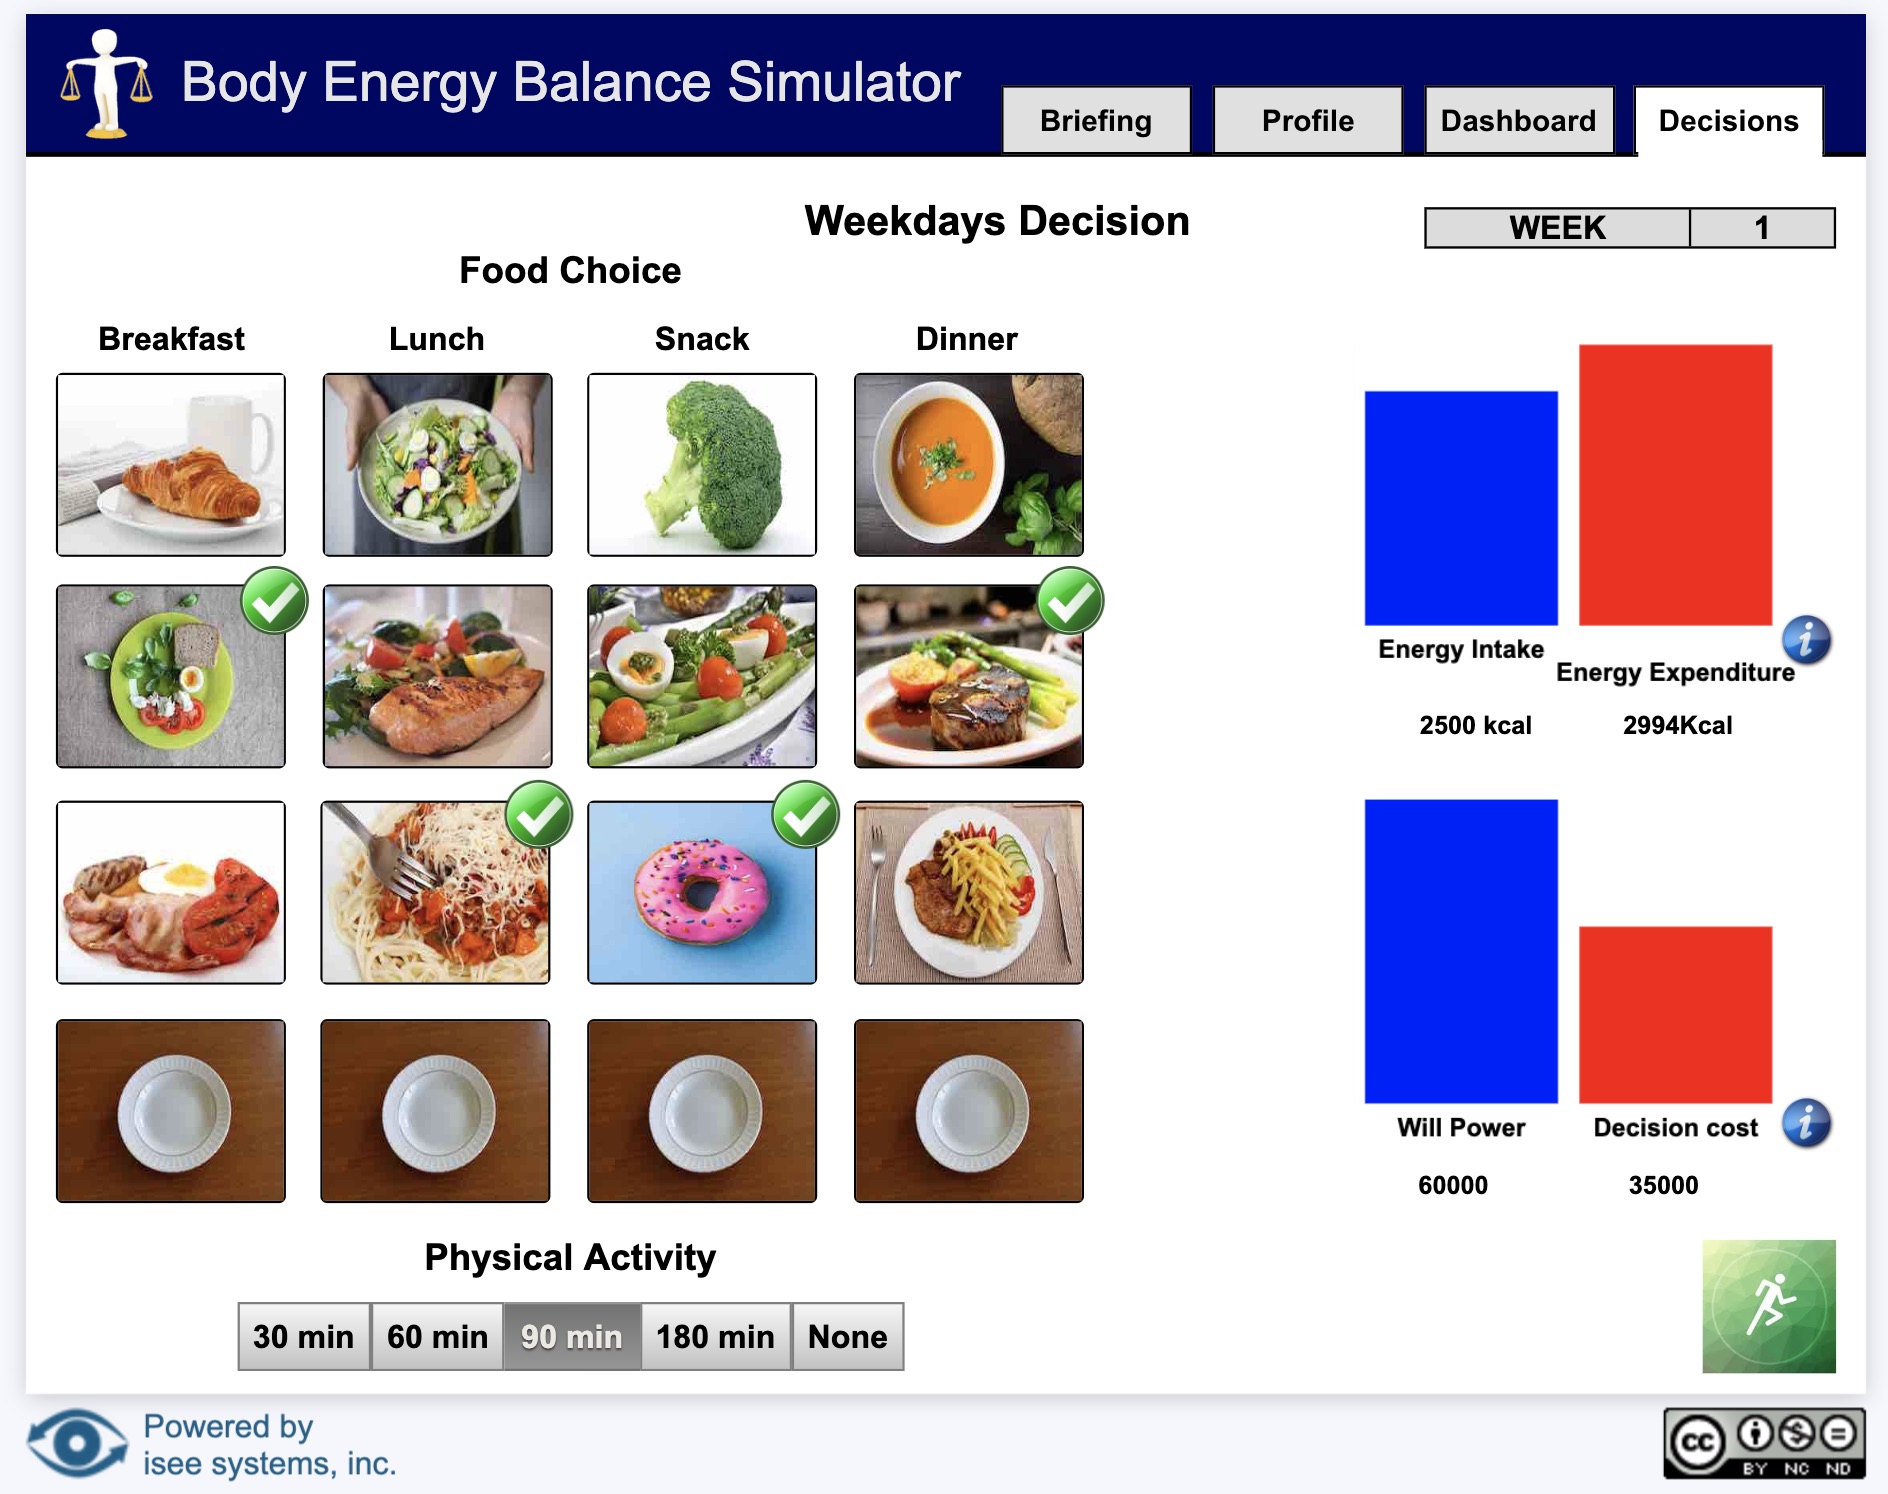
Image of a sim

Sim apps allow users to interact with a model using buttons, sliders, knobs, tables, graphs, and storytelling. These interactions help users understand how parts of a system interact.

Interfaces are created by model authors in the Stella desktop software and can be uploaded to the isee Exchange™.

Model

A diagram that represents how elements in a system influence one another.
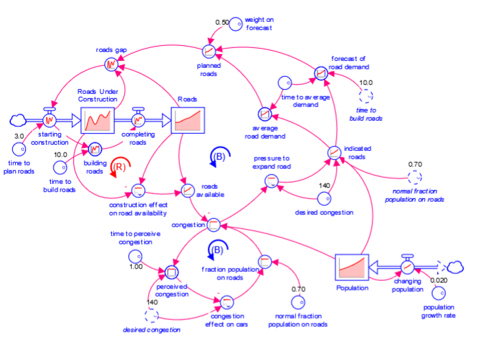
Image of a model

Models are mathematical representations of how elements in a system are connected and interact (e.g., ecosystems, organizations, supply chains). When running models on the isee Exchange™, results can be viewed in output devices like graphs and tables.

Models appear in the isee Exchange™ directory when authors upload them from the Stella® desktop software or create them with Stella Online™.

Causal Loop Diagram (CLD)

A map that represents the feedback structure of a system.
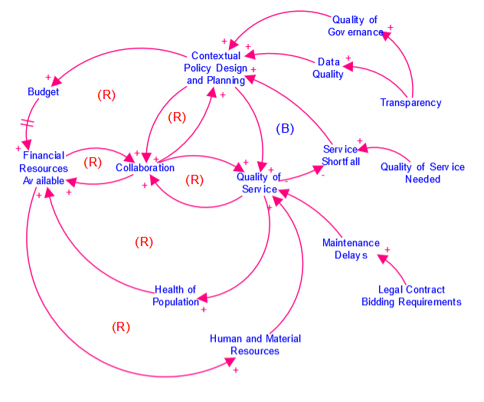
Image of a CLD

CLDs are high-level maps that represents the feedback structure of a system and easily communicate the essence of a model. They appear in the isee Exchange™ when authors upload them from the Stella desktop software or create them with Stella Online™.