Peter Victor's Profile
Number of items: 4
Date joined: Jul 16 2018
Website: www.managingwithoutgrowth.com
I am an ecological economist. I have worked on environment-economy-energy issues for 50 years.
Peter Victor's Work
#1
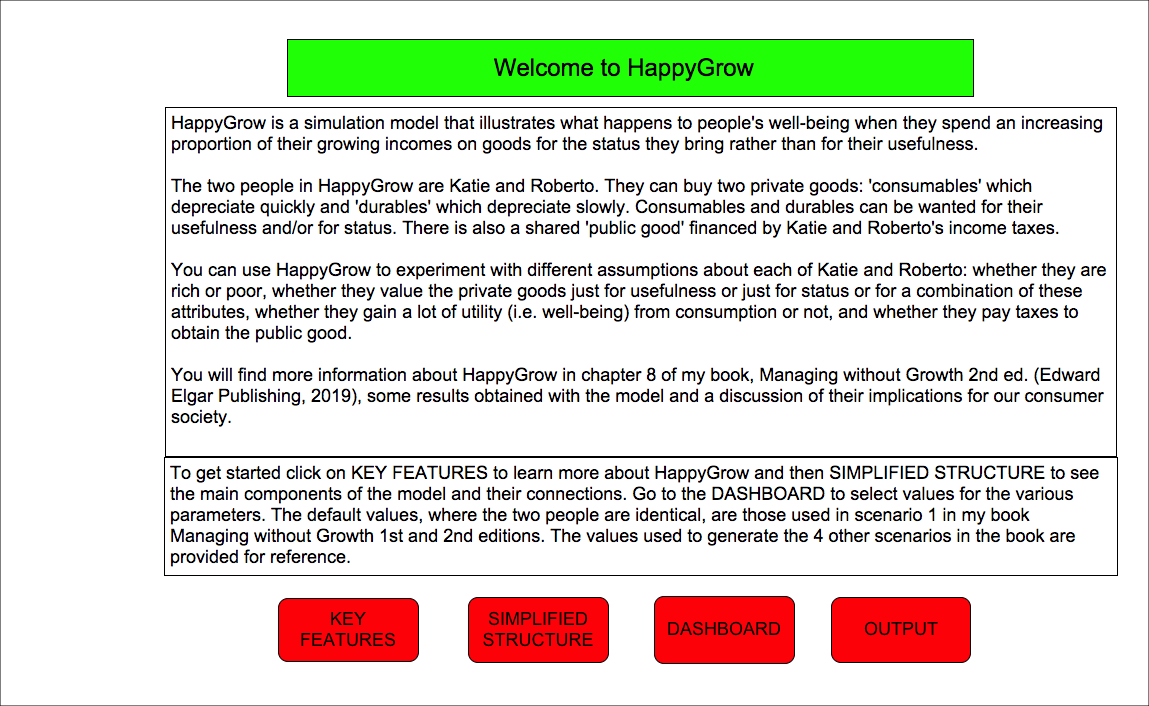
HappyGrow
A simulation of people's well-being derived from commodities that differ in usefulness and status
sim
⋮ 535 runs
consumption
well-being
status
utility
#2
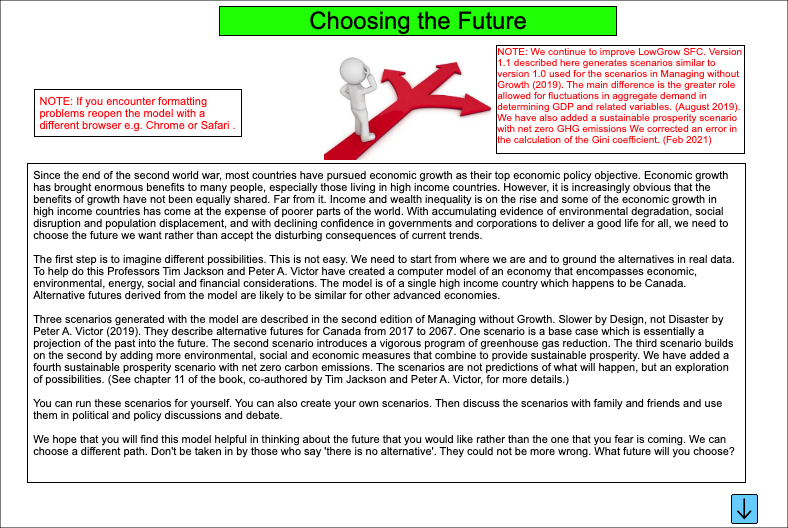
Choosing the Future
Users can run 3 long term scenarios for the Canadian economy featured in Managing without Growth (2n
... Read more
Users can run 3 long term scenarios for the Canadian economy featured in Managing without Growth (2nd edition) and create their own
sim
⋮ 7252 runs
economic growth
post-growth
no growth
sustainable prosperity
environment
#3
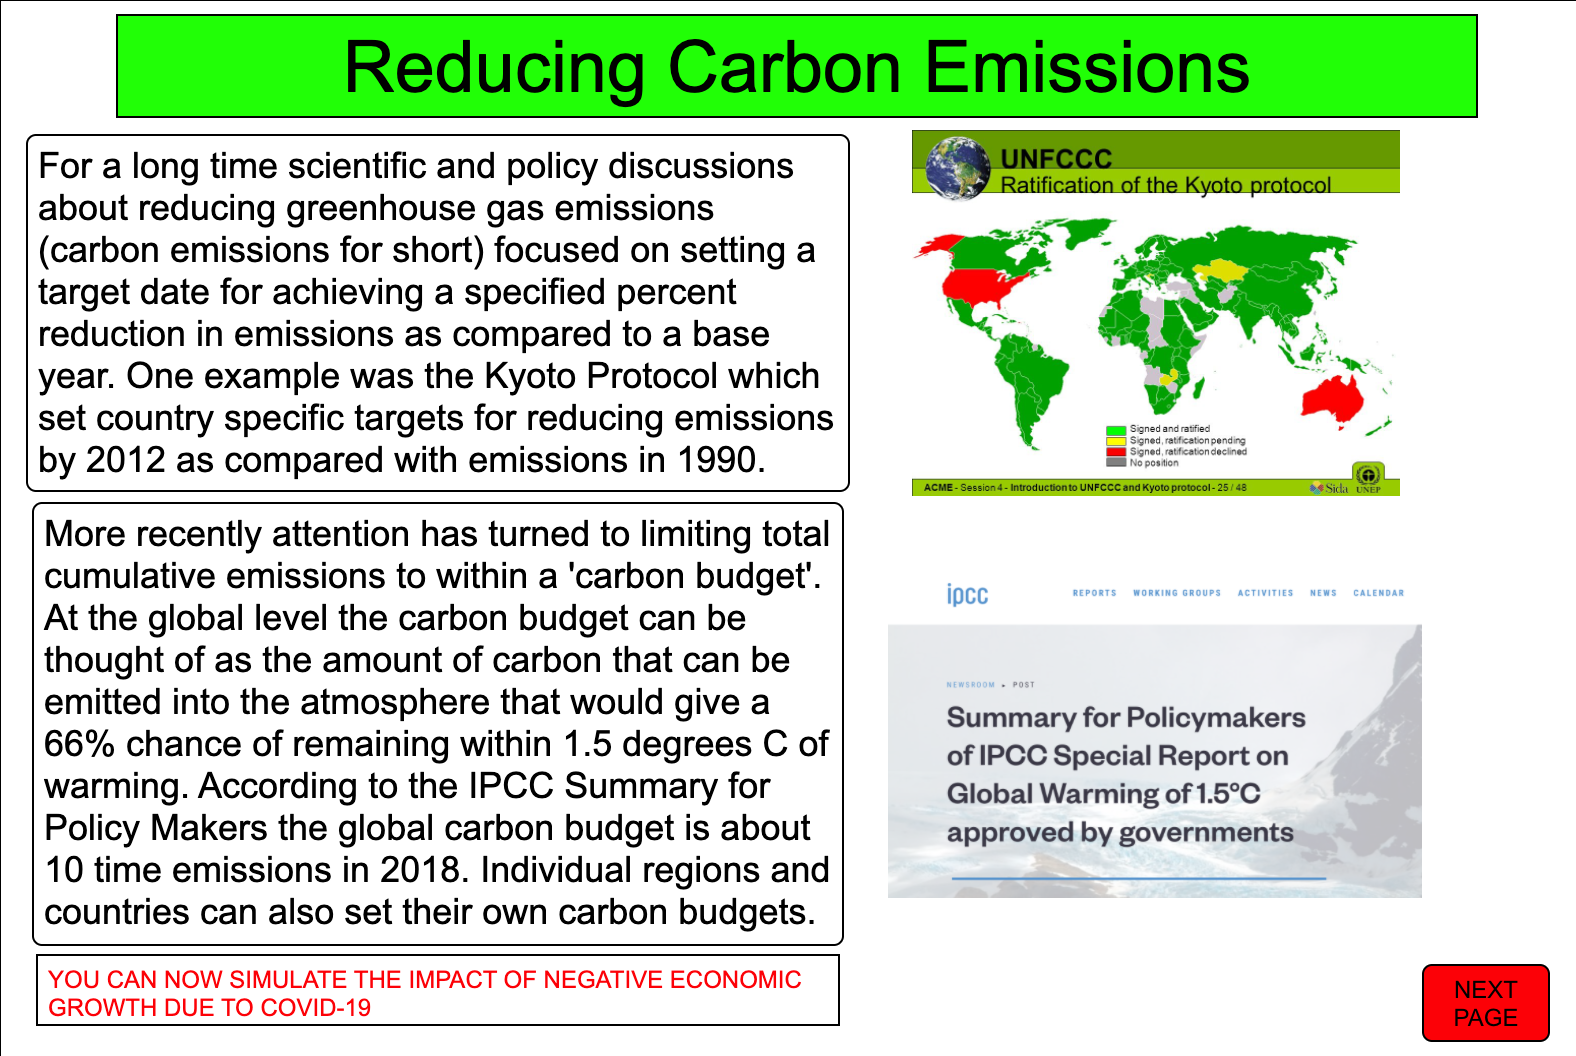
Carbon Budget Simulator
This model determines the number of years in which the global carbon budget will be exhausted. You s
... Read more
This model determines the number of years in which the global carbon budget will be exhausted. You set the carbon budget as a multiple of current carbon dioxide emissions. You choose a rate of economic growth and a rate of reduction in emissions intensity (emissions/GDP). The model puases when the carbon budget is exhausted. The model can be used to determine the exhaustion of national and regional carbon budgets as well following the same steps.
sim
⋮ 1412 runs
Environment
Technology
Science
Economics
#4
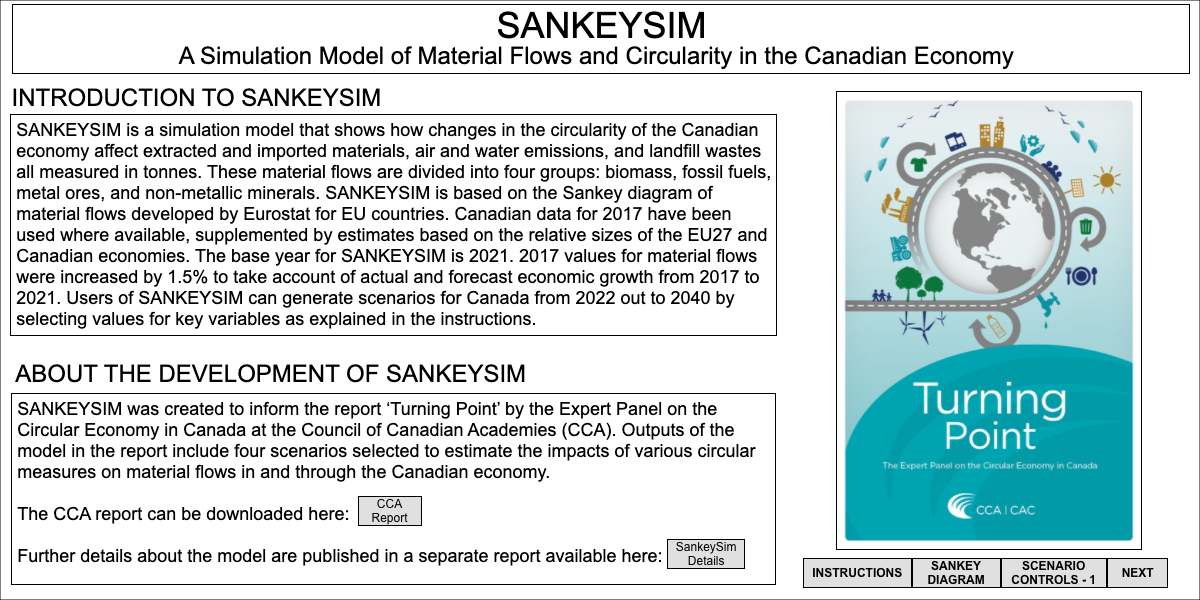
SANKEYSIM
A simulation model of material flows and circularity in the Canadian economy
sim
⋮ 769 runs
Environment
Economics
Uploading a Bundle from Zip
Instead of creating bundles, categories, and assemblies one by one, you can upload a single zip file that contains all of your bundle's content. To create your zipped bundle, make a folder with your bundle's name and add subfolders with your categories' names. The folder tree should have the same structure that you want the categories to have in your bundle. Place your assembly .stmx files in the appropriate category folders, then zip your bundle folder and upload it using the Upload Bundle from Zip link above.
Assemblies, Bundles, and Categories
Assemblies are self contained models that demonstrate common ways to connect together building blocks and that can be used as parts of other models. This is analogous to using prefabricated wall and roof pieces to construct a house.
Bundles are groups of assemblies with a common use or theme. For example, a Health Care bundle might contain a variety of assemblies that aid in creating health care models. When you download assemblies from the isee Exchange™, you download an entire bundle, rather than individual assemblies.
Categories are subgroups of assemblies within a bundle. For example, a Health Care bundle might contain a Funding category for assemblies related to the management of hospital funds. All assemblies must be assigned to a category—they cannot be assigned to the root of a bundle.
Assemblies, bundles, and categories can be created and uploaded to the isee Exchange™ via the options on the Manage My Assemblies page. To learn more, visit our help pages, or take our assemblies tutorial.
Sim App (Sim)
An interface that allows users to interact with a model.
Sim apps allow users to interact with a model using buttons, sliders, knobs, tables, graphs, and storytelling. These interactions help users understand how parts of a system interact.
Interfaces are created by model authors in the Stella desktop software and can be uploaded to the isee Exchange™.
Model
A diagram that represents how elements in a system influence one another.
Models are mathematical representations of how elements in a system are connected and interact (e.g., ecosystems, organizations, supply chains). When running models on the isee Exchange™, results can be viewed in output devices like graphs and tables.
Models appear in the isee Exchange™ directory when authors upload them from the Stella® desktop software or create them with Stella Online™.
Causal Loop Diagram (CLD)
A map that represents the feedback structure of a system.

CLDs are high-level maps that represents the feedback structure of a system and easily communicate the essence of a model. They appear in the isee Exchange™ when authors upload them from the Stella desktop software or create them with Stella Online™.