Lorenzo Andrade's Profile

Number of items: 34
Date joined: Sep 02 2016
Lorenzo Andrade's Work
#1
gemoviGraf
sim
⋮ 39 runs
#2
indmov
sim
⋮ 38 runs
Environment
#3
gemovdinamico
sim
⋮ 52 runs
#4
ALAO_MDL
sim
⋮ 107 runs
#5

MECHUQUE_MDL
sim
⋮ 17 runs
#6
MODELO AMC-DS
sim
⋮ 157 runs
Environment
Economics
Ecology
Education
#7
DT1
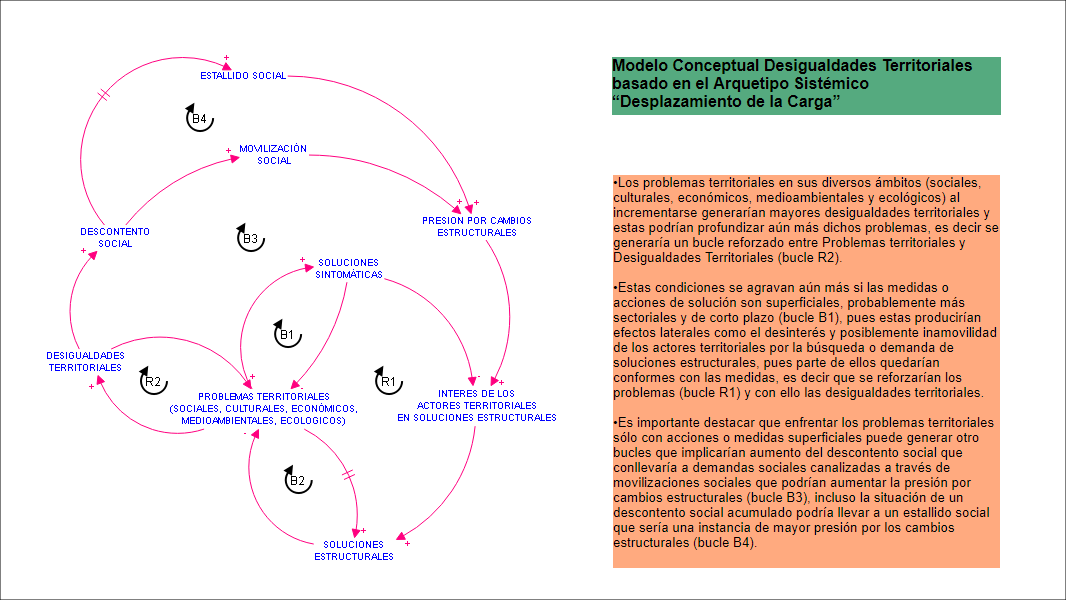
Aproximación a un Modelo Conceptual sobre Desigualdades Territoriales
sim
Environment
Economics
Ecology
Education
Health
#8
DT2
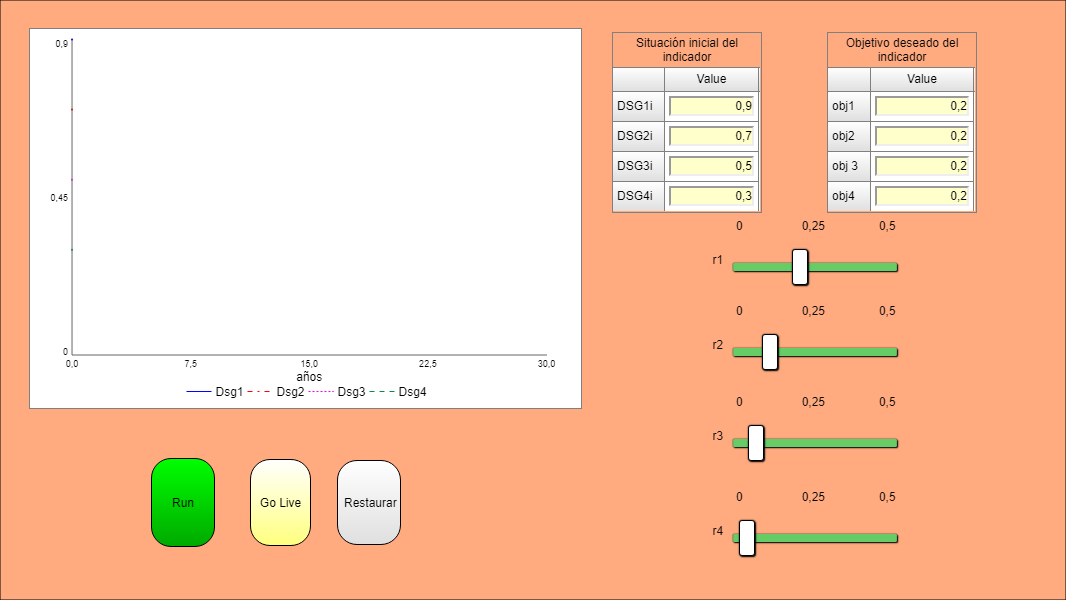
Indicador DT
sim
⋮ 48 runs
#9
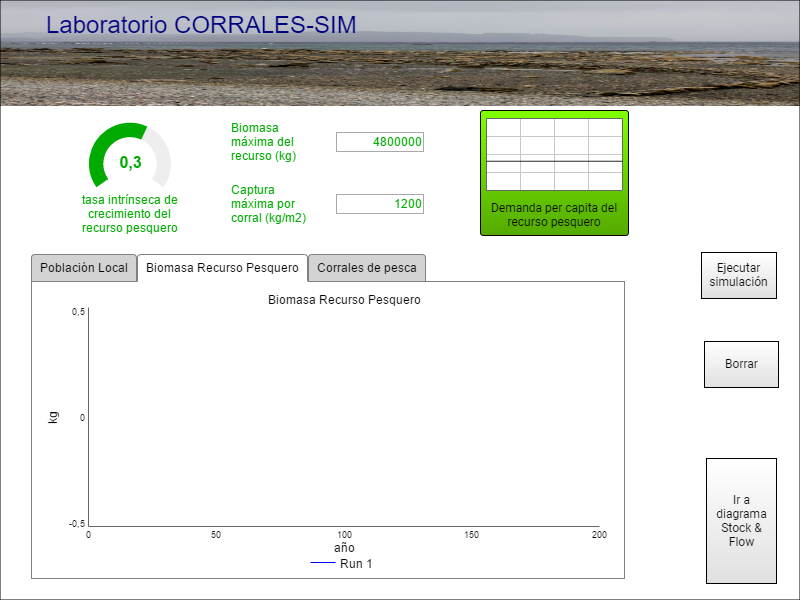
CORRALES-SIM
Corrales de pesca
sim
⋮ 197 runs
Corrales de pesca
#10
proyectando futuribles
sim
⋮ 26 runs
Environment
Economics
Ecology
#11
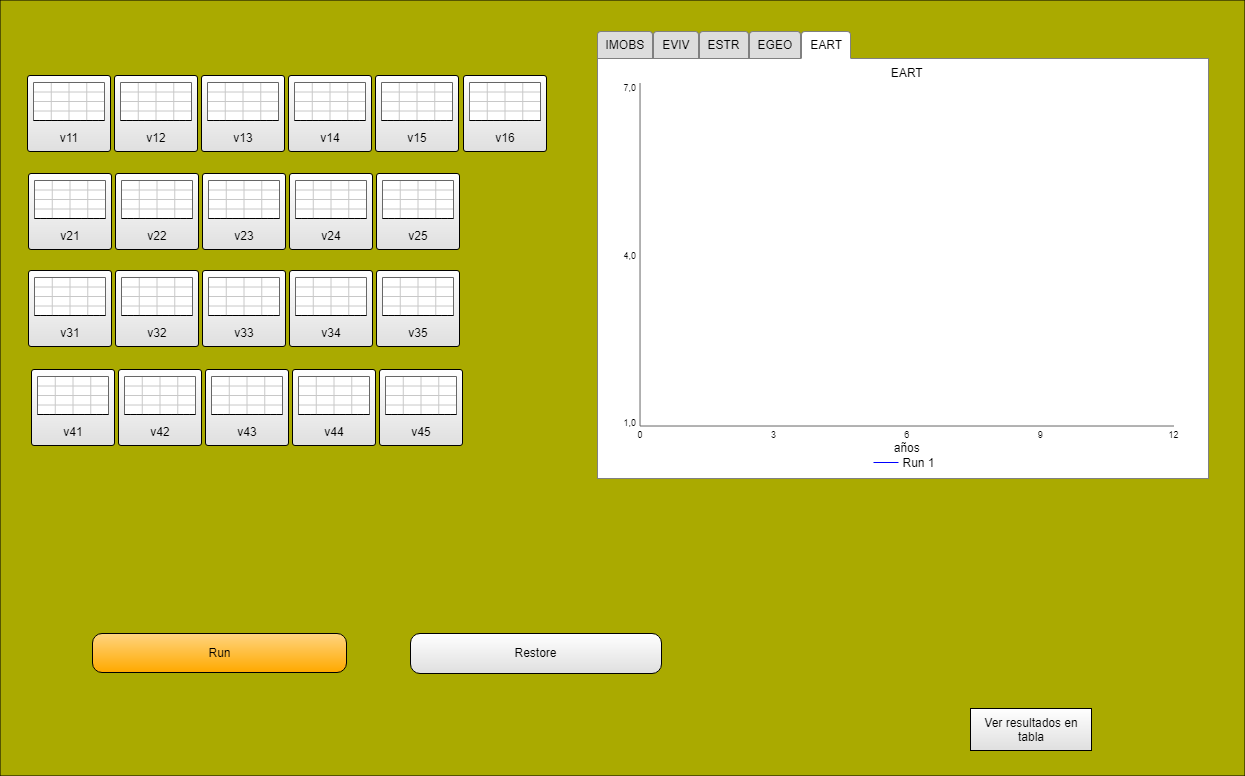
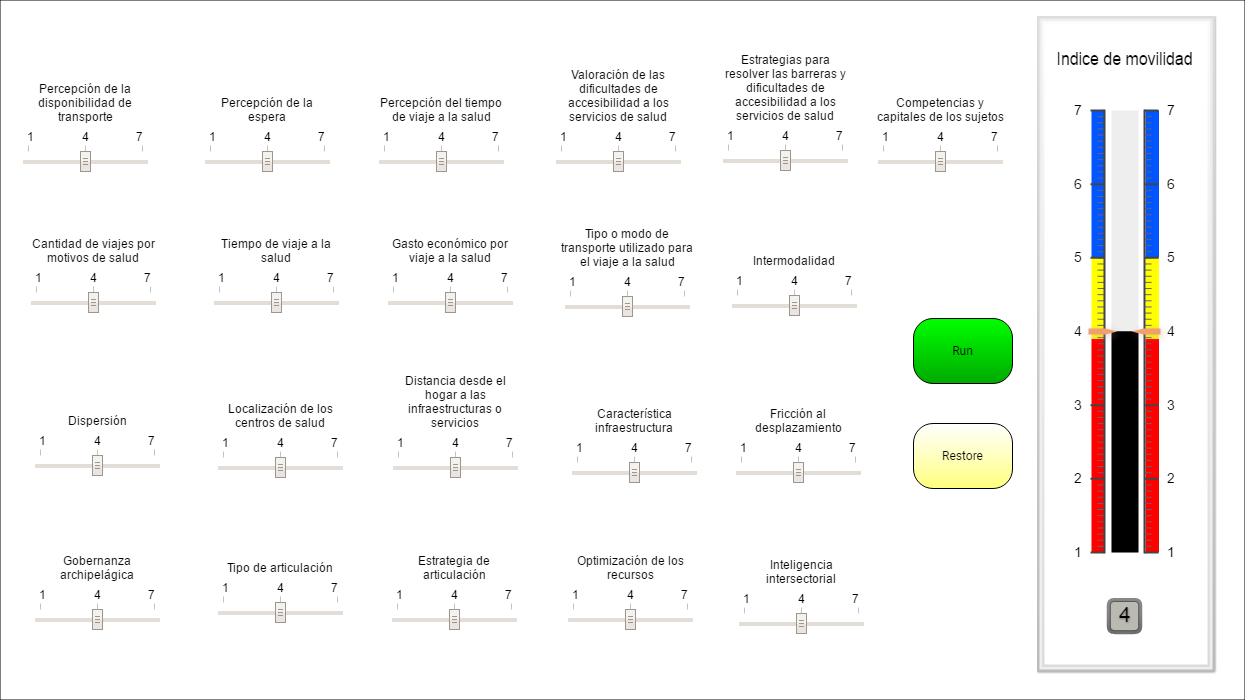
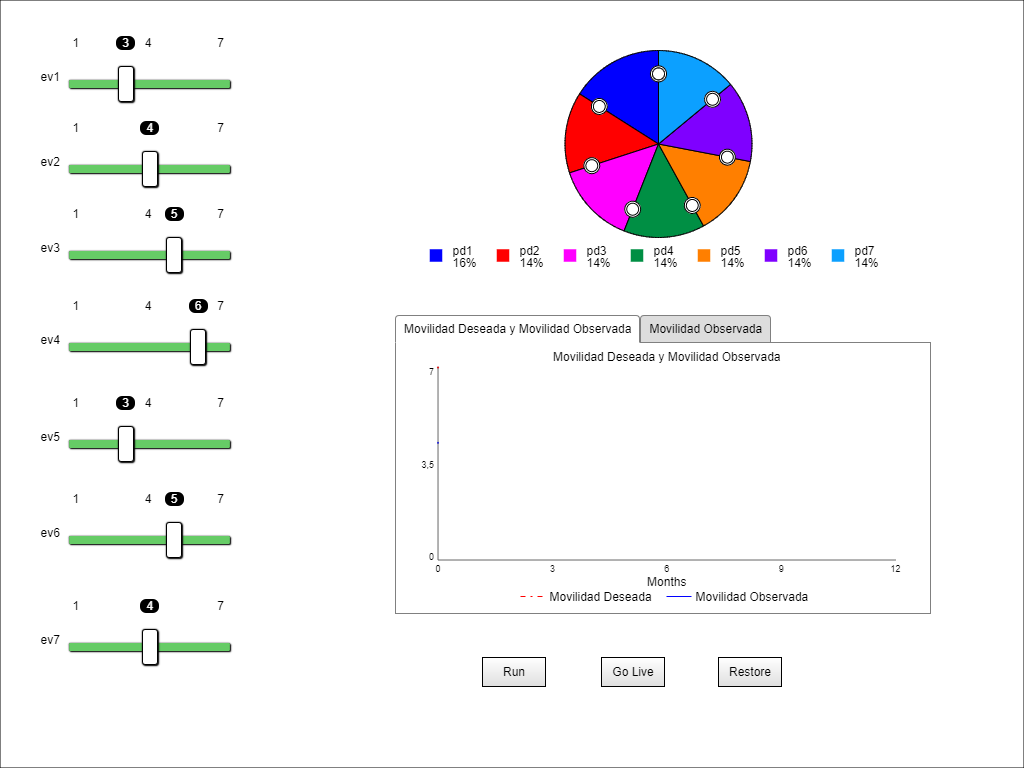
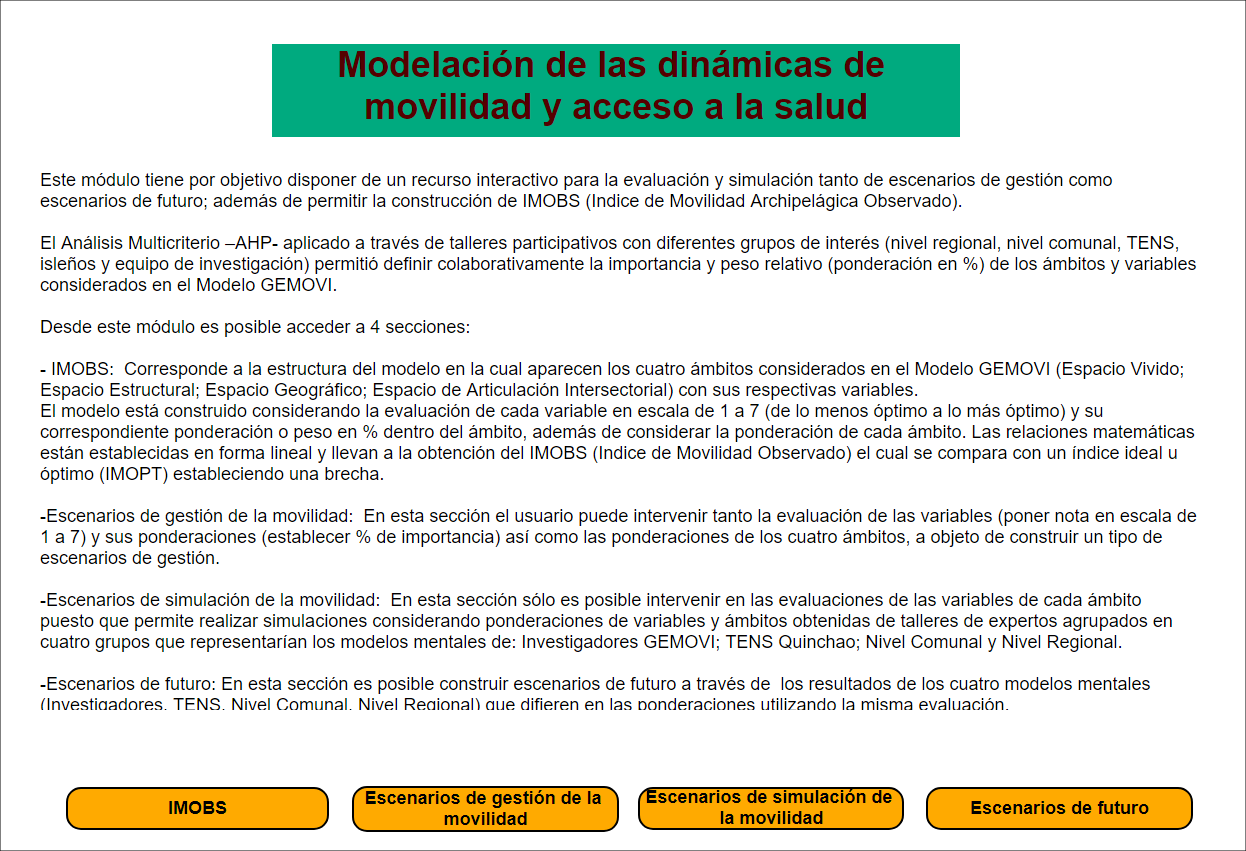
gemovi2
Movilidad insular
sim
⋮ 102 runs
Territorial Mangement
#12
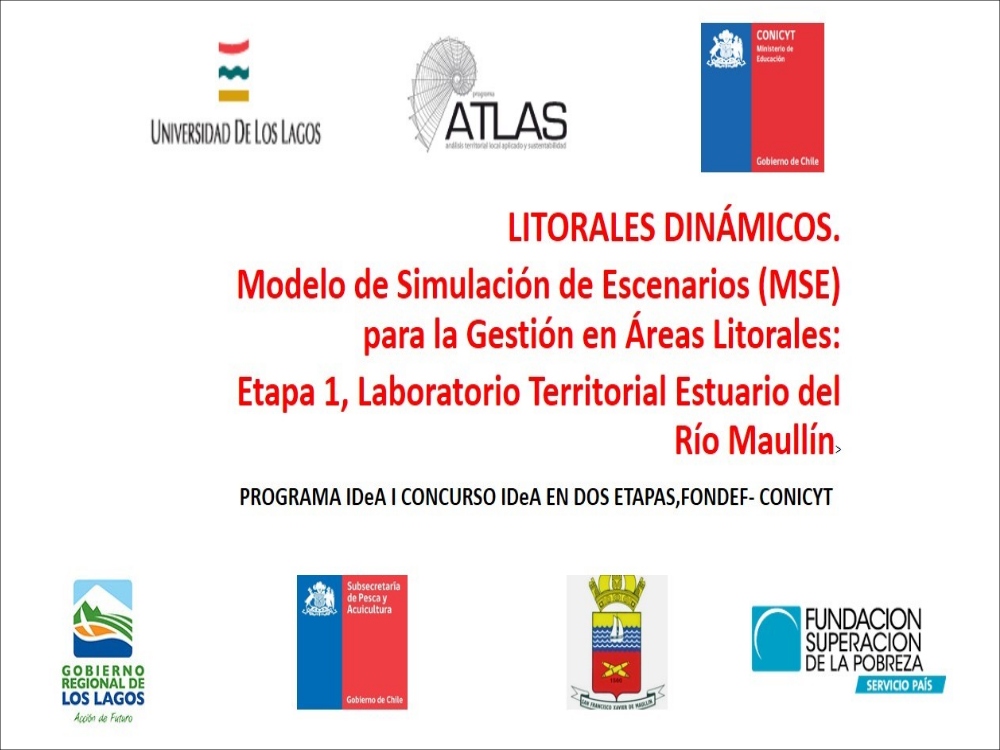
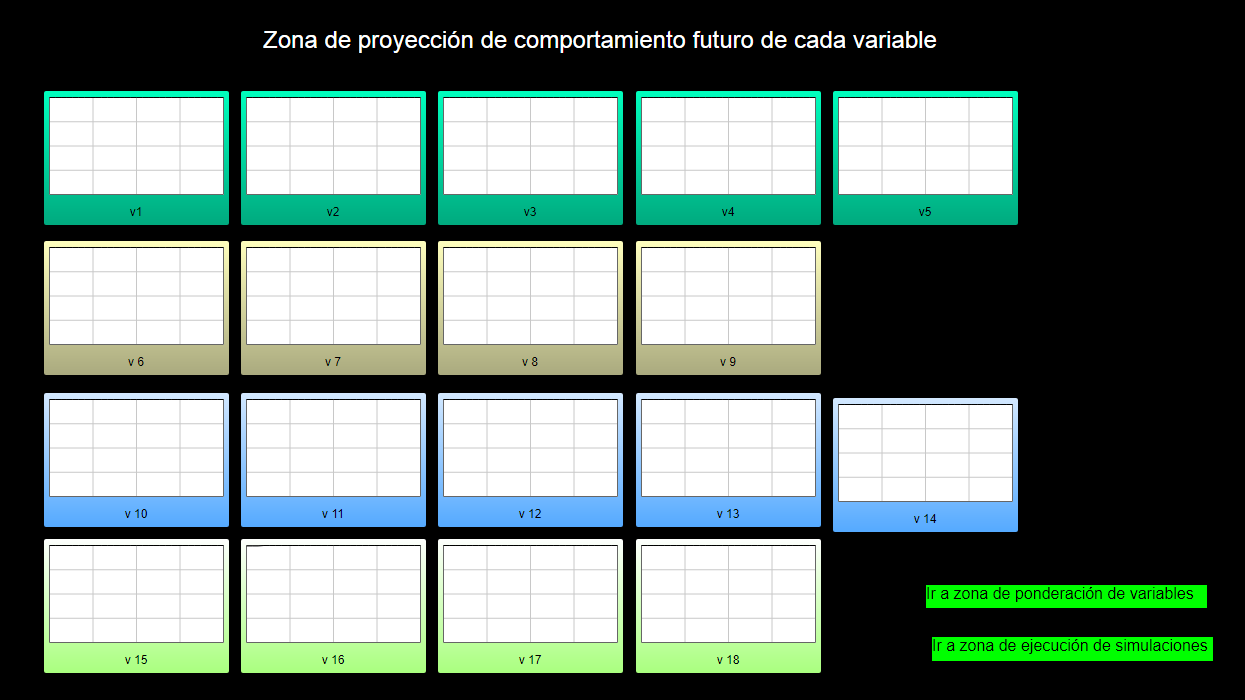
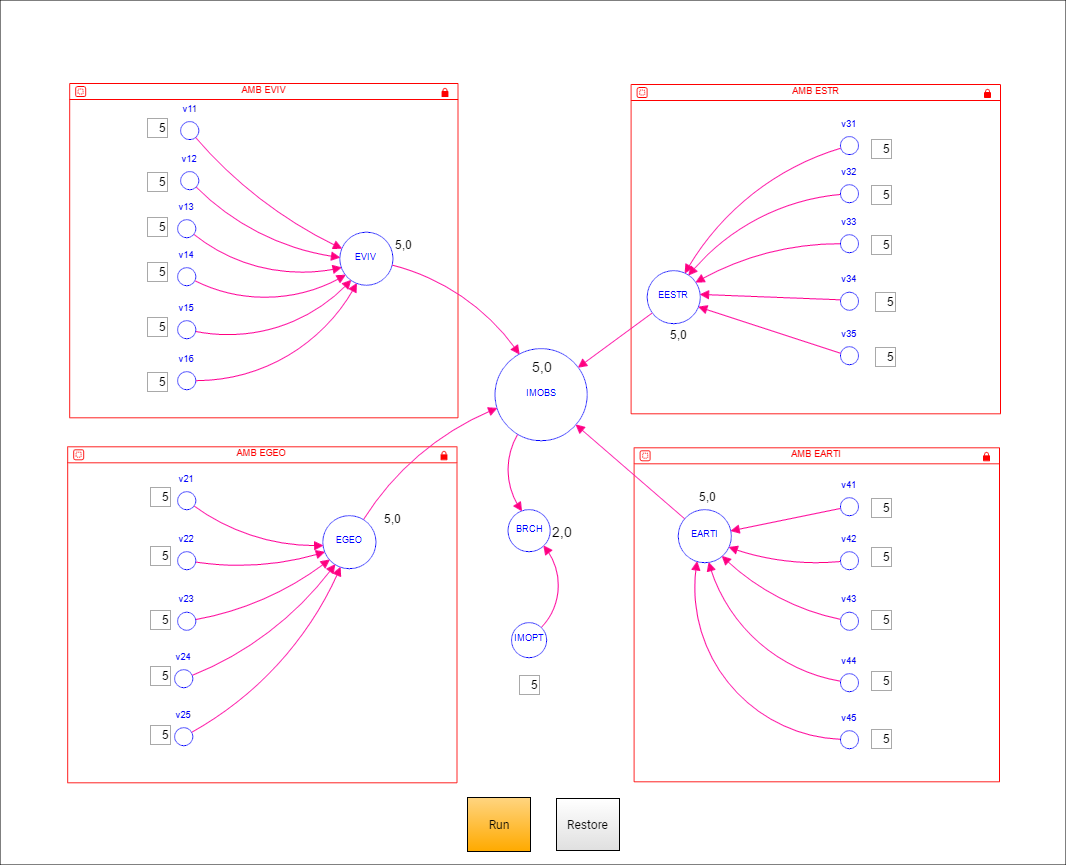
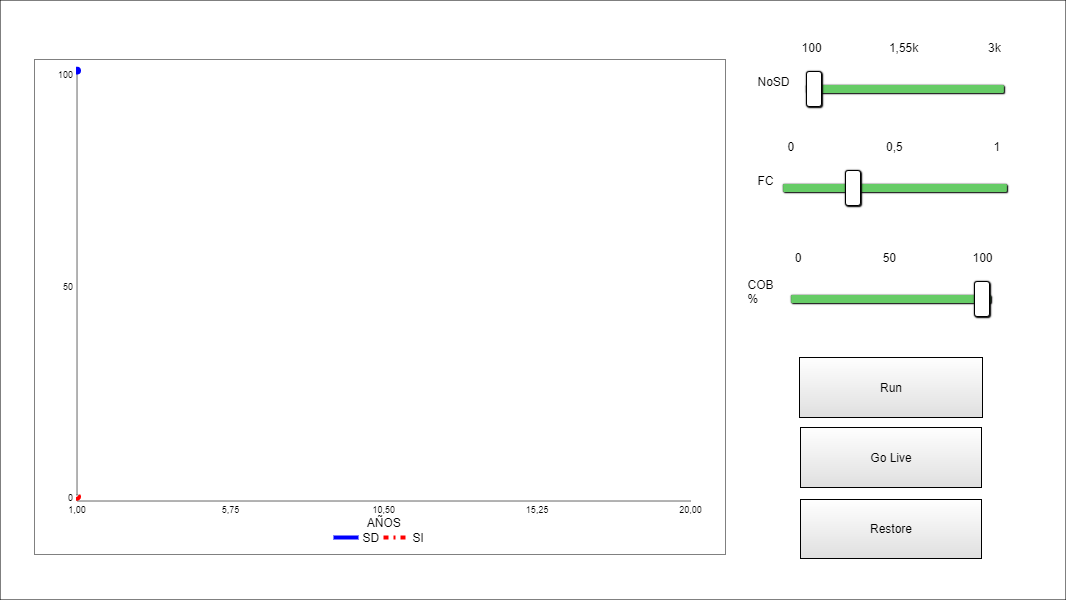
mse-litsim
Modelo de Simulación de Escenarios MSE-LITSIM
sim
⋮ 989 runs
gestión áreas litorales
eutrofización
estuarios
humedales
#13
prrueba
prueba
sim
⋮ 13 runs
prueba
#14

AÑIHUE_MDL
sim
⋮ 41 runs
#15

aguaAGO
sim
⋮ 39 runs
#16
gemovi marzo 2020
sim
⋮ 48 runs
#17
rbc_captura
sim
⋮ 424 runs
#18
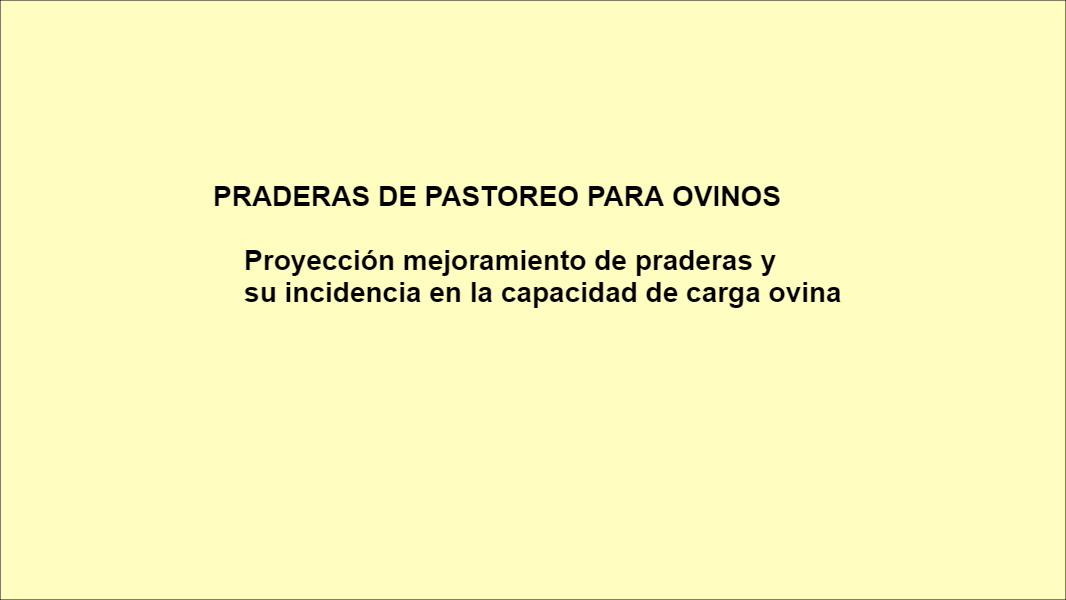
pradera
Pradera y capacidad de carga ovina
sim
⋮ 80 runs
pradera
productividad pradera
carga ovina
oferta forrajera
#19
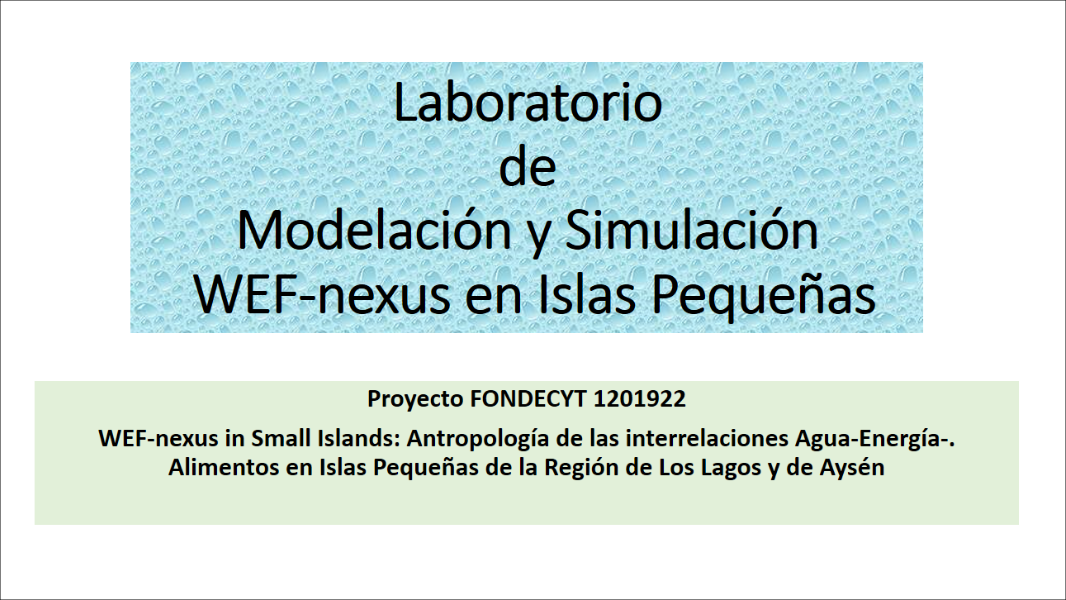
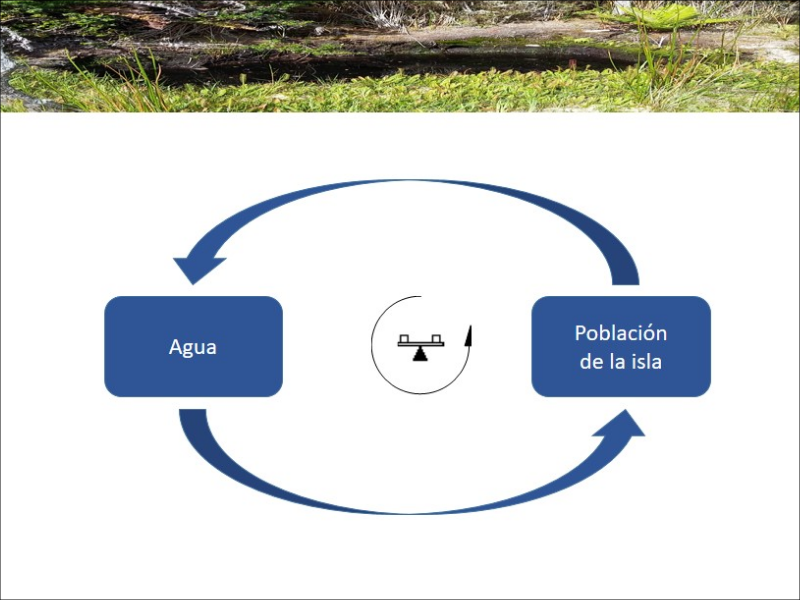
wef-nexus-small-island
sim
⋮ 53 runs
#20

prueba_QUELL
sim
⋮ 64 runs
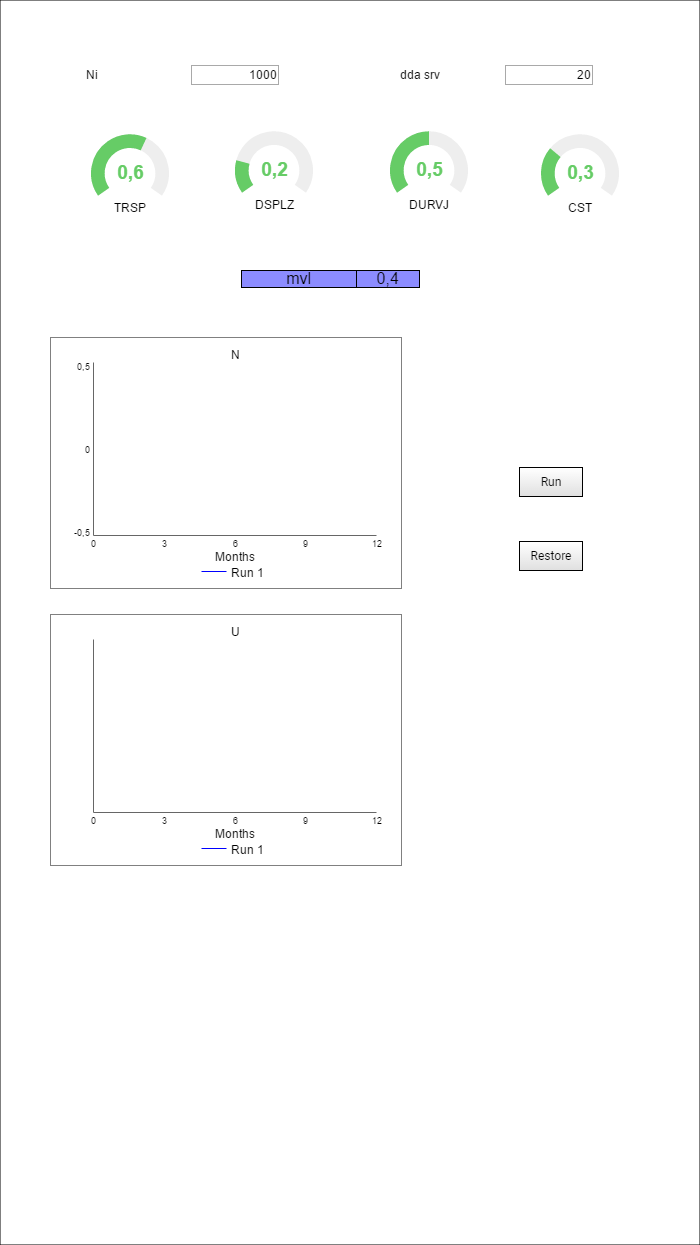
#21
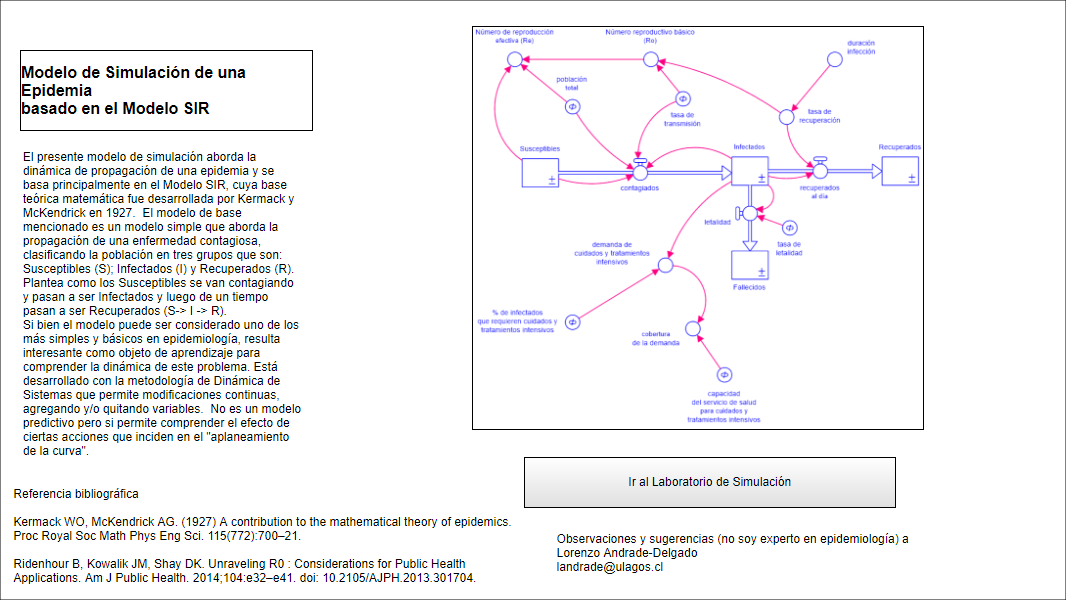
SIR1
Epidemia, Pandemia
sim
⋮ 398 runs
Environment
Biology
Education
#22
gemovi1
sim
⋮ 40 runs
#23
mamb
sim
⋮ 29 runs
#24

LINLIN_MDL
sim
⋮ 22 runs
#25
quellon
sim
⋮ 18 runs
#26

APIAO_MDL
sim
⋮ 29 runs
#27
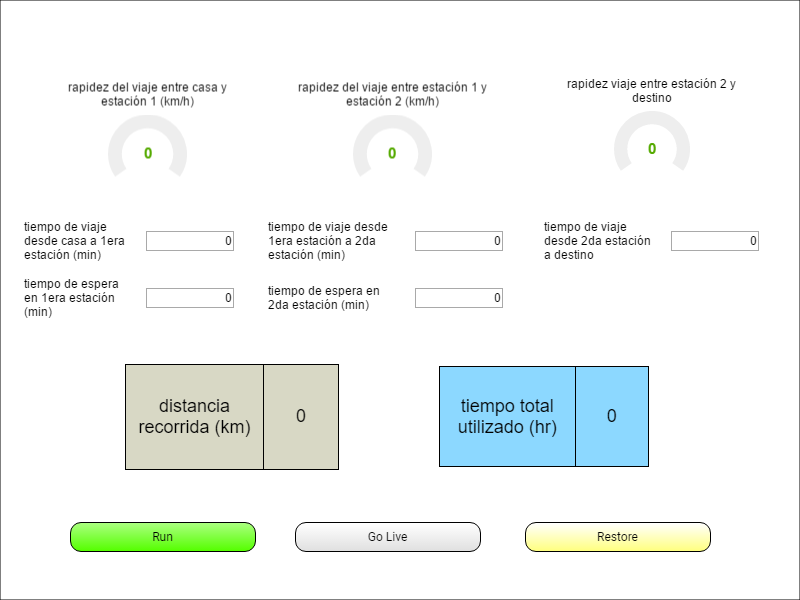
el_viaje
sim
⋮ 20 runs
#28
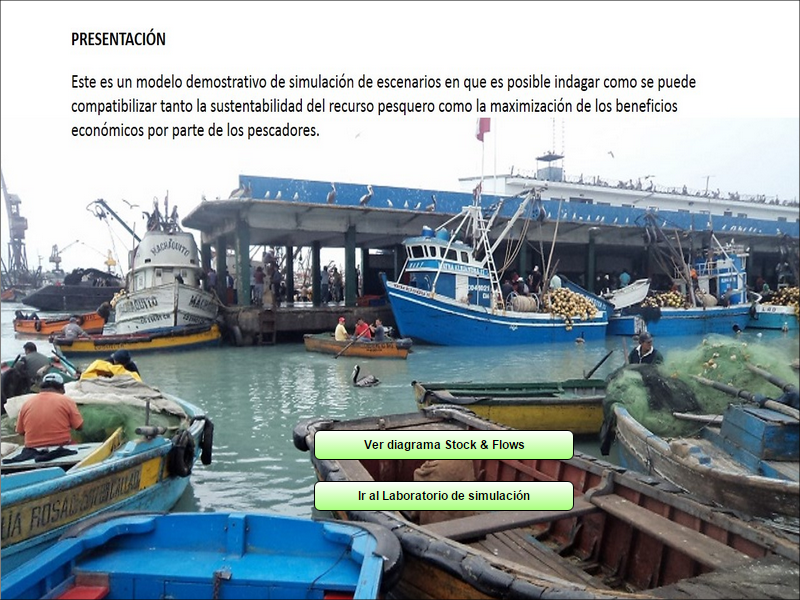
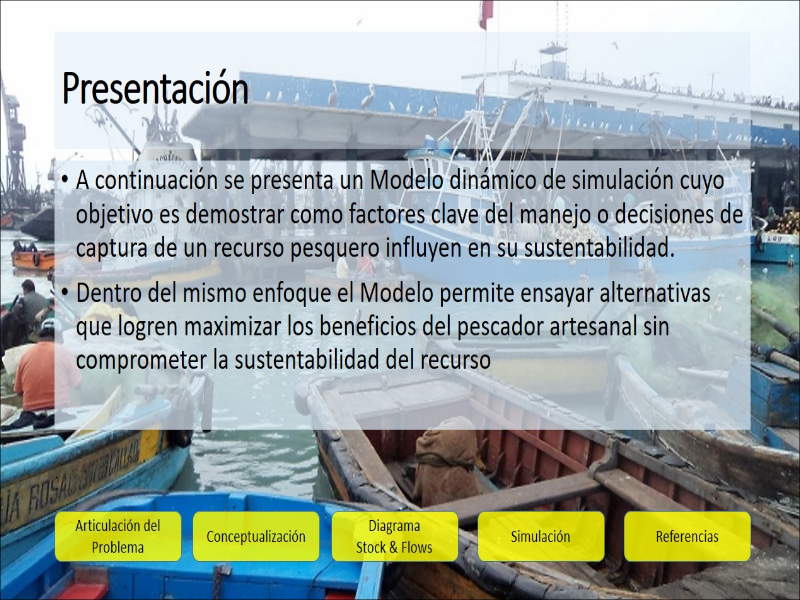
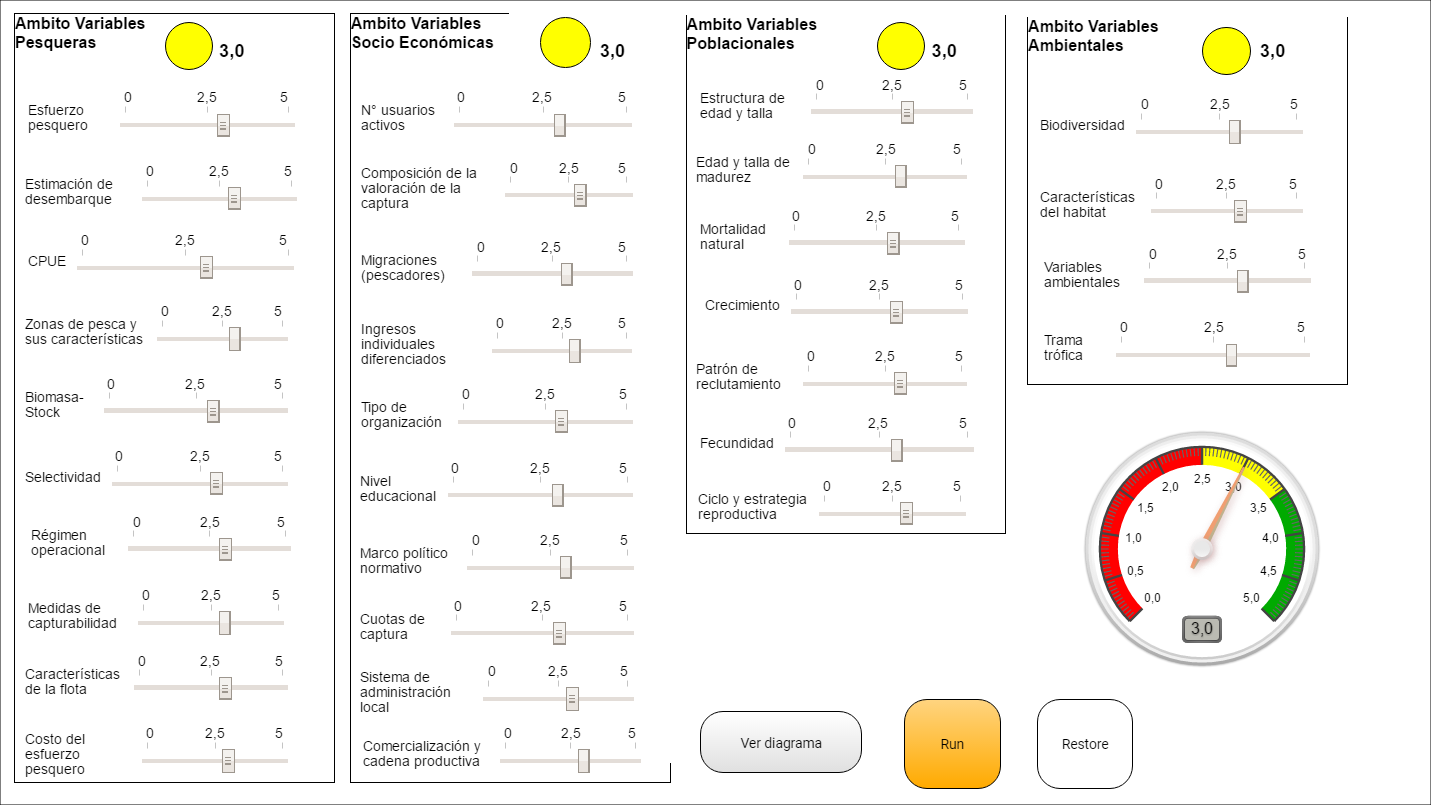
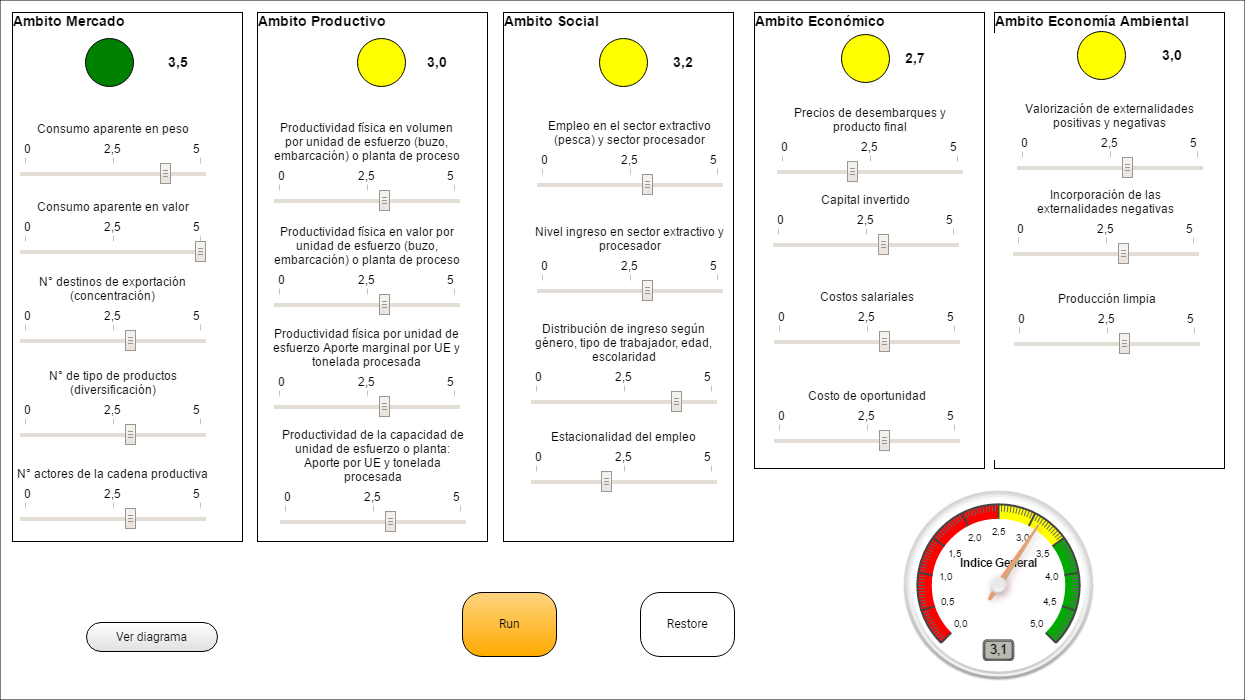
pescarbc
Este es un modelo demostrativo de simulación de escenarios en que es posible indagar como se puede c
... Read more
Este es un modelo demostrativo de simulación de escenarios en que es posible indagar como se puede compatibilizar tanto la sustentabilidad del recurso pesquero como la maximización de los beneficios económicos por parte de los pescadores.
sim
⋮ 163 runs
pesca
relación beneficio costo
precio venta unitario
#29
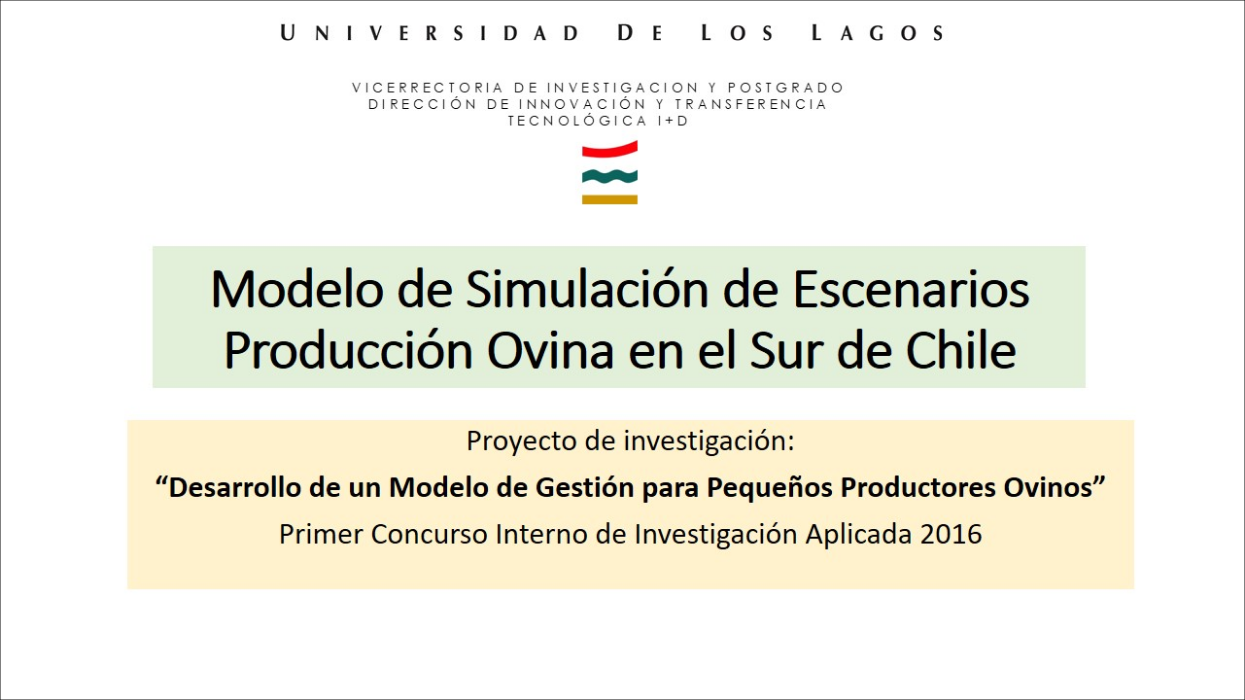
Produccion Ovina en el Sur de Chile
Se trata de un modelo diseñado y desarrollado en un proyecto de investigación interno de la Universi
... Read more
Se trata de un modelo diseñado y desarrollado en un proyecto de investigación interno de la Universidad de Los Lagos (Osorno, Chile)
sim
⋮ 399 runs
ovinos
balance forrajero
rentabilidad
#30
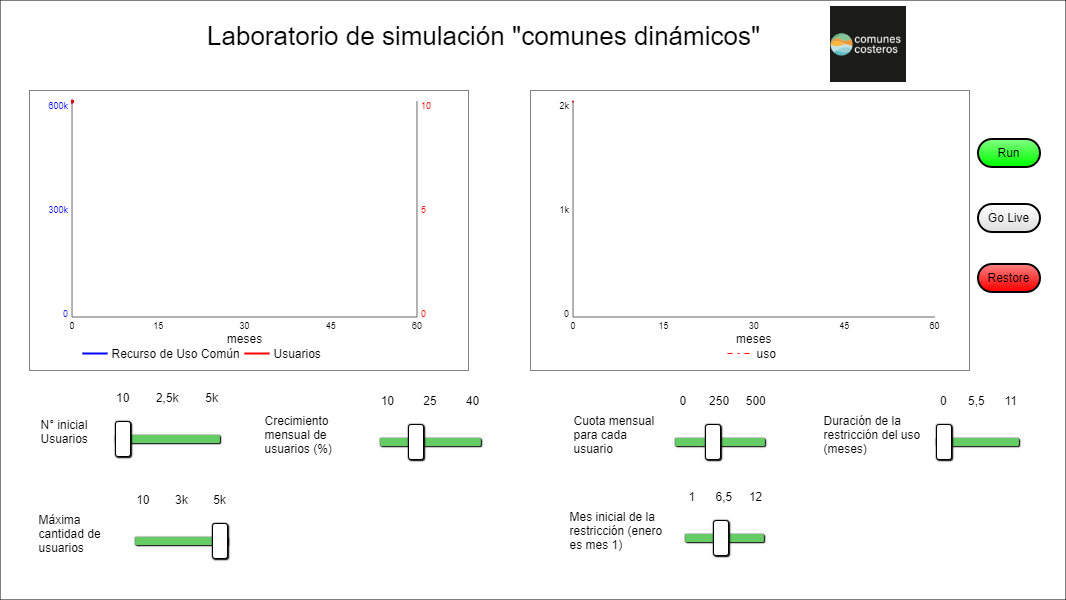
laboratrio comunes dinámicos
Ejemplo
sim
⋮ 149 runs
Environment
Science
Economics
Ecology
#31
valpo
sim
⋮ 26 runs
#32
pmontt
sim
⋮ 51 runs
#33

TAUCOLON_MDL
sim
⋮ 64 runs
#34
gemovi_marzo2020
sim
⋮ 238 runs
Uploading a Bundle from Zip
Instead of creating bundles, categories, and assemblies one by one, you can upload a single zip file that contains all of your bundle's content. To create your zipped bundle, make a folder with your bundle's name and add subfolders with your categories' names. The folder tree should have the same structure that you want the categories to have in your bundle. Place your assembly .stmx files in the appropriate category folders, then zip your bundle folder and upload it using the Upload Bundle from Zip link above.
Assemblies, Bundles, and Categories
Assemblies are self contained models that demonstrate common ways to connect together building blocks and that can be used as parts of other models. This is analogous to using prefabricated wall and roof pieces to construct a house.
Bundles are groups of assemblies with a common use or theme. For example, a Health Care bundle might contain a variety of assemblies that aid in creating health care models. When you download assemblies from the isee Exchange™, you download an entire bundle, rather than individual assemblies.
Categories are subgroups of assemblies within a bundle. For example, a Health Care bundle might contain a Funding category for assemblies related to the management of hospital funds. All assemblies must be assigned to a category—they cannot be assigned to the root of a bundle.
Assemblies, bundles, and categories can be created and uploaded to the isee Exchange™ via the options on the Manage My Assemblies page. To learn more, visit our help pages, or take our assemblies tutorial.
Sim App (Sim)
An interface that allows users to interact with a model.
Sim apps allow users to interact with a model using buttons, sliders, knobs, tables, graphs, and storytelling. These interactions help users understand how parts of a system interact.
Interfaces are created by model authors in the Stella desktop software and can be uploaded to the isee Exchange™.
Model
A diagram that represents how elements in a system influence one another.
Models are mathematical representations of how elements in a system are connected and interact (e.g., ecosystems, organizations, supply chains). When running models on the isee Exchange™, results can be viewed in output devices like graphs and tables.
Models appear in the isee Exchange™ directory when authors upload them from the Stella® desktop software or create them with Stella Online™.
Causal Loop Diagram (CLD)
A map that represents the feedback structure of a system.

CLDs are high-level maps that represents the feedback structure of a system and easily communicate the essence of a model. They appear in the isee Exchange™ when authors upload them from the Stella desktop software or create them with Stella Online™.