Ryan Bellmore's Profile

Number of items: 12
Date joined: Sep 08 2016
Ryan Bellmore's Work
#1
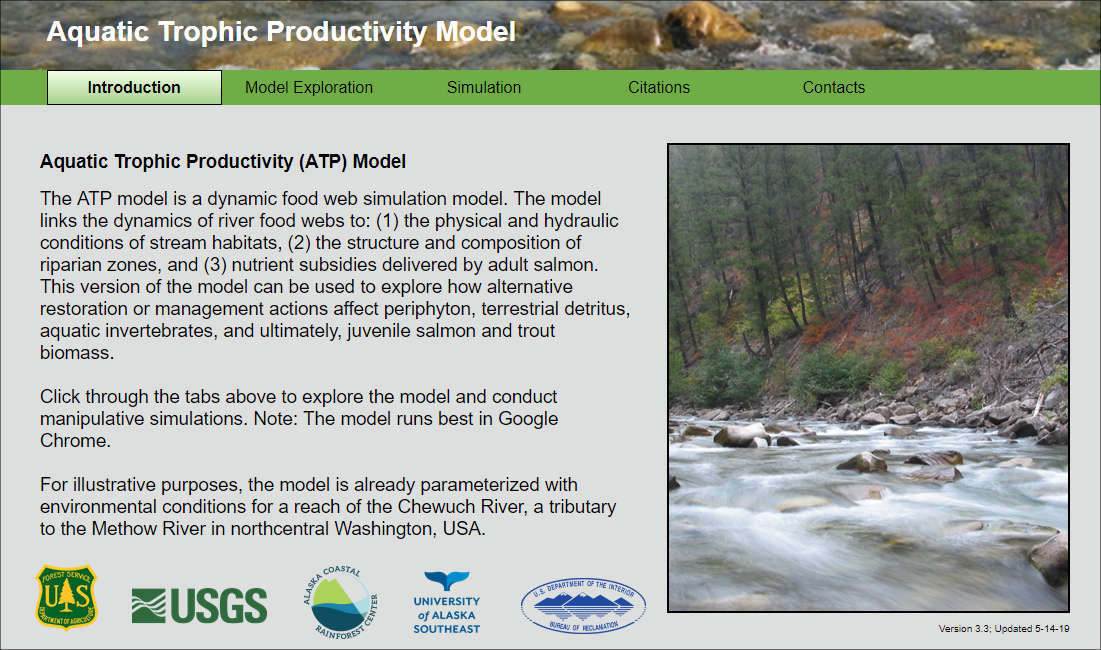
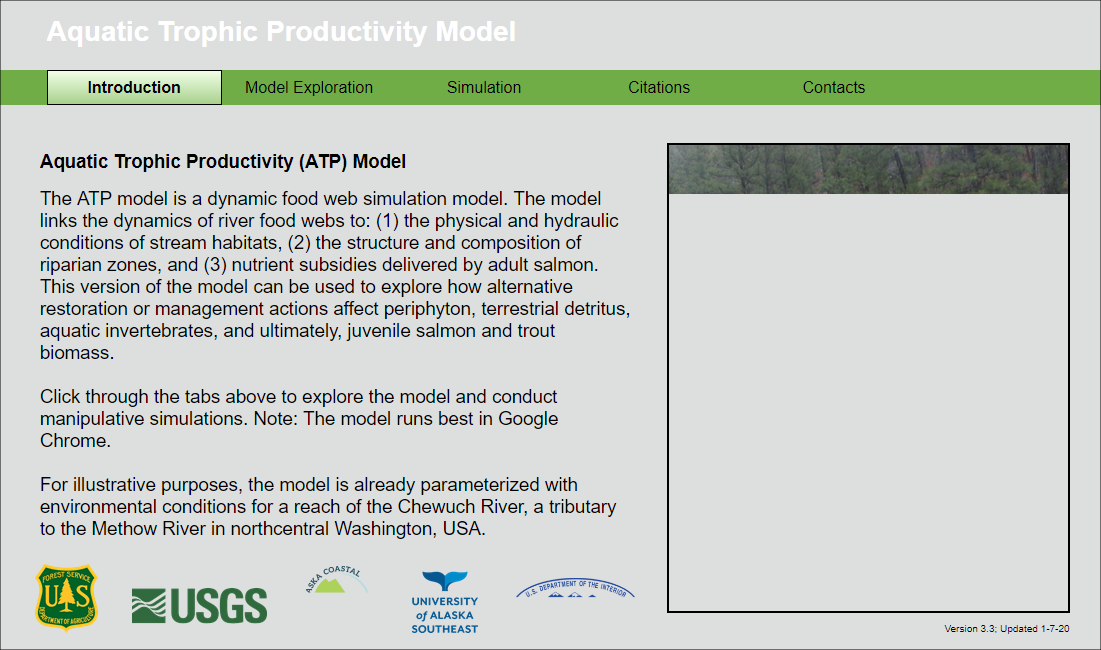
Aquatic Trophic Productivity Model
The ATP model is a dynamic food web simulation model.
sim
⋮ 2781 runs
food webs
river restoration
fish biomass
#2
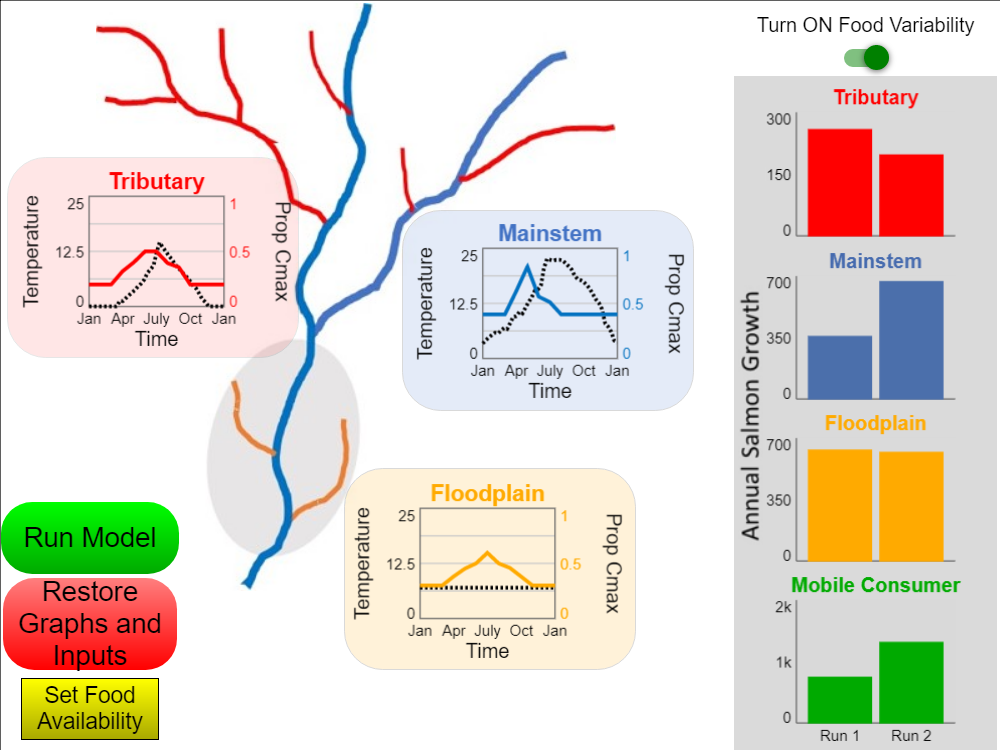
Riverscape Food Simulation
sim
⋮ 81 runs
#3
Salmon Life Cycle Simulator (Fish Creek, Juneau, AK)
sim
⋮ 55 runs
#4
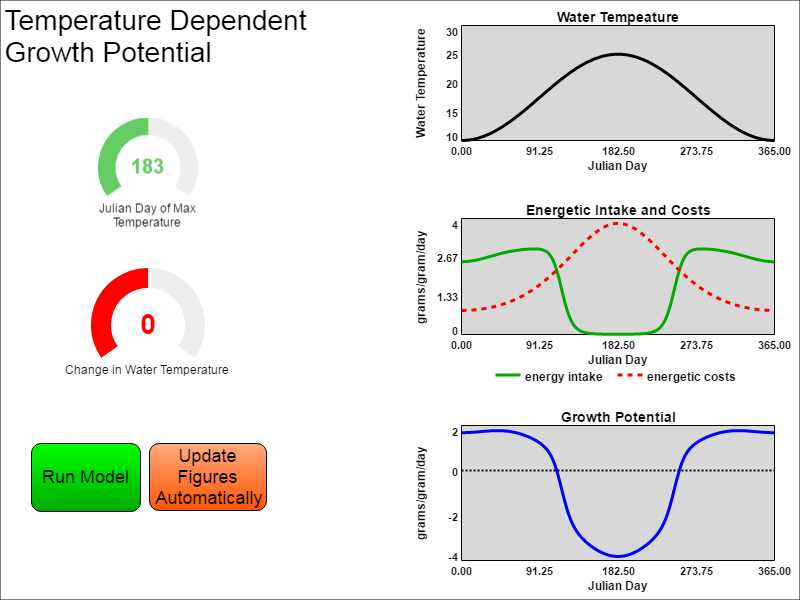
Temperature Dependent Salmonids Growth Potential
sim
⋮ 118 runs
#5
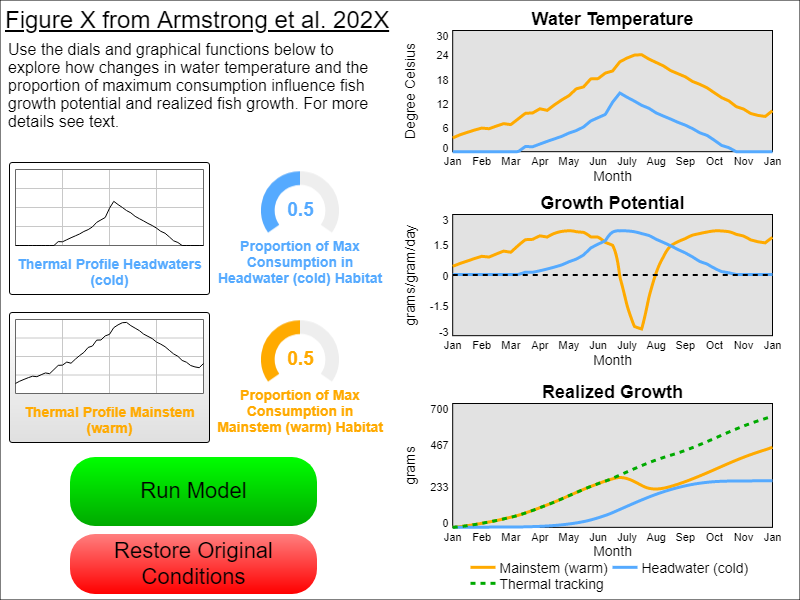
Thermal Diversity & Fish Growth
sim
⋮ 260 runs
#6
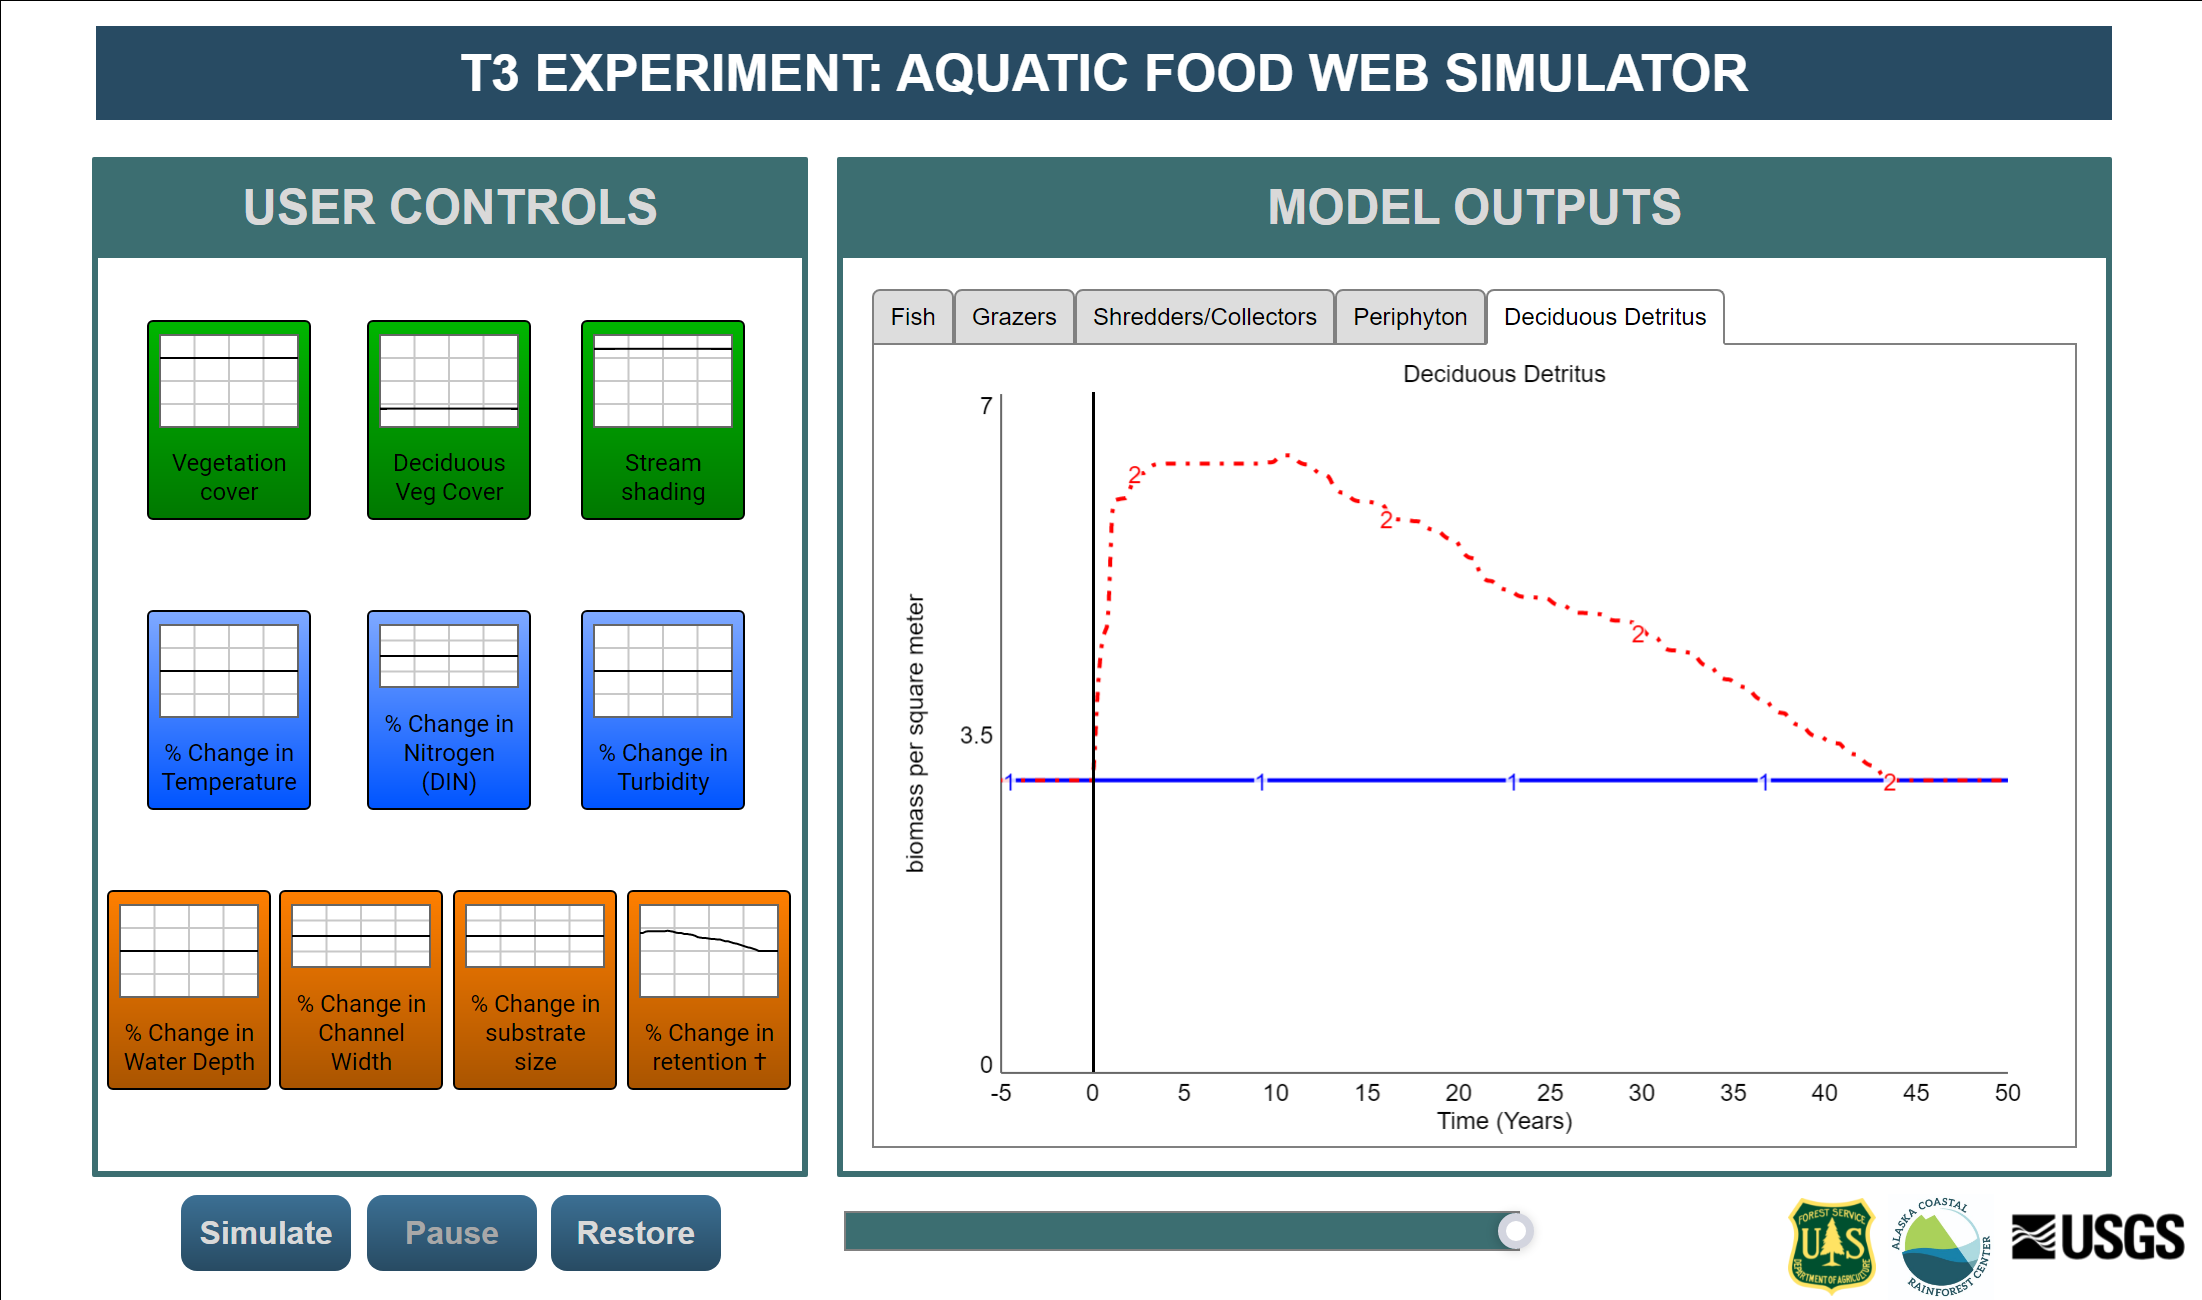
T3 Experiment: Aquatic Food Web Simulator
sim
⋮ 258 runs
Environment
Ecology
#7
Fish Foodscape IBM Example
sim
⋮ 374 runs
Environment
Ecology
#8
Aquatic Trophic Productivity Model (2)
sim
⋮ 40 runs
#9
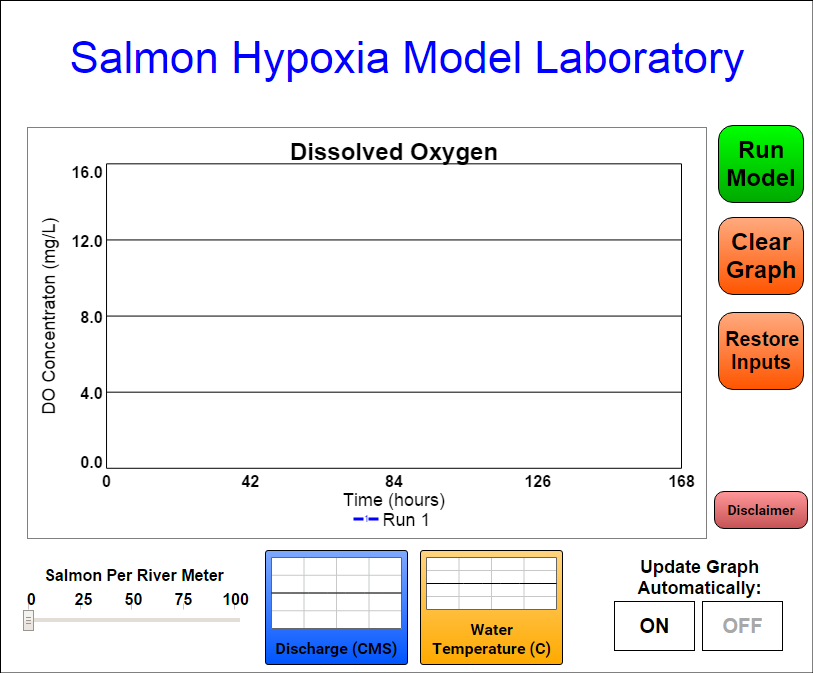
Salmon Hypoxia Modeling Lab
This model simulates the influence of spawning salmon on dissolved oxygen in southeast Alaskan River
... Read more
This model simulates the influence of spawning salmon on dissolved oxygen in southeast Alaskan Rivers.
sim
⋮ 502 runs
Pacific salmon
water quality
dissolved oxygen
hypoxia
ecological modeling
#10
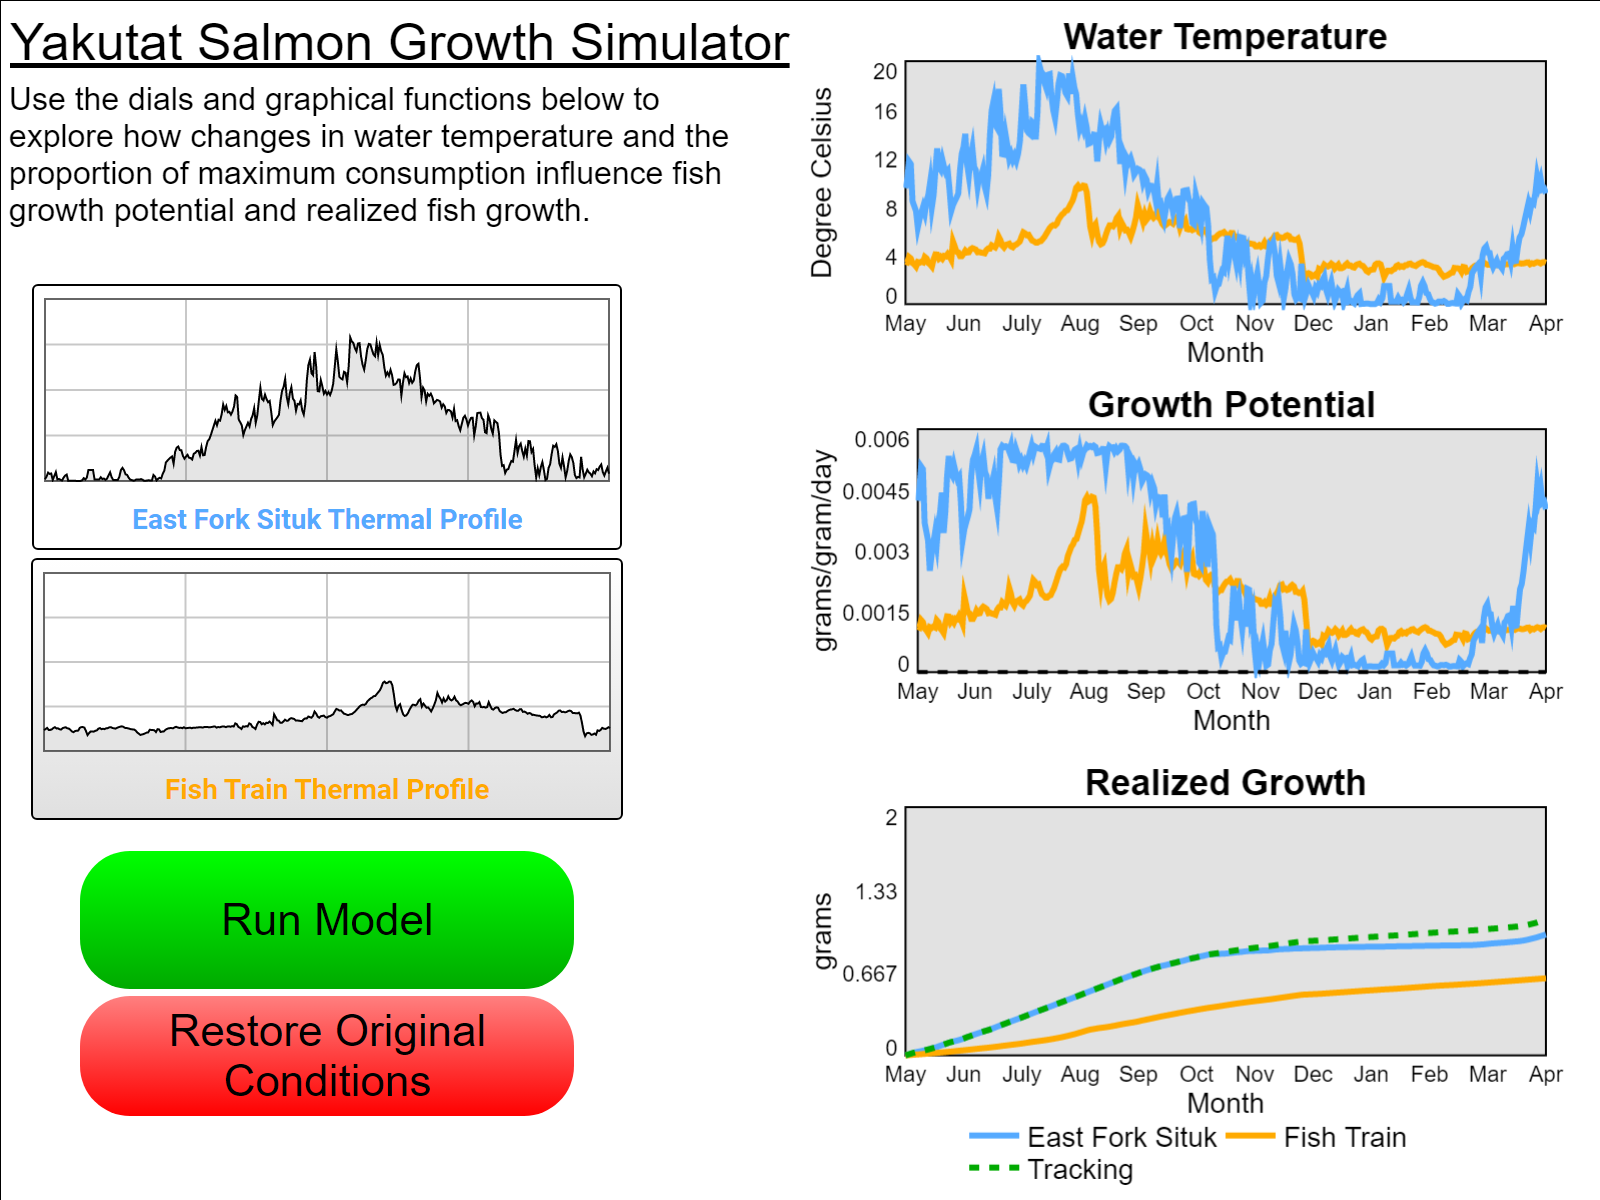
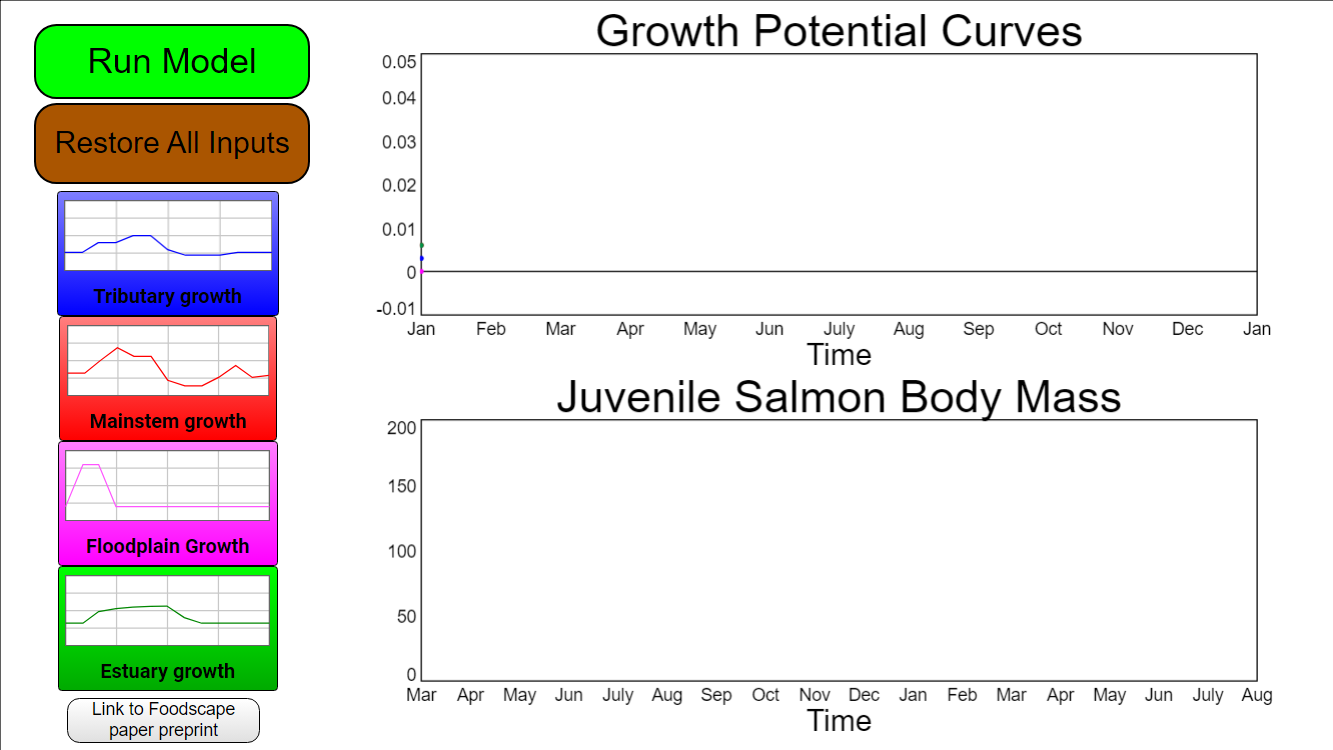
Yakutat Salmon Growth Simulator
sim
⋮ 15 runs
Environment
Ecology
#11
Eel River toy foodscape model
sim
⋮ 5 runs
Environment
Ecology
#12
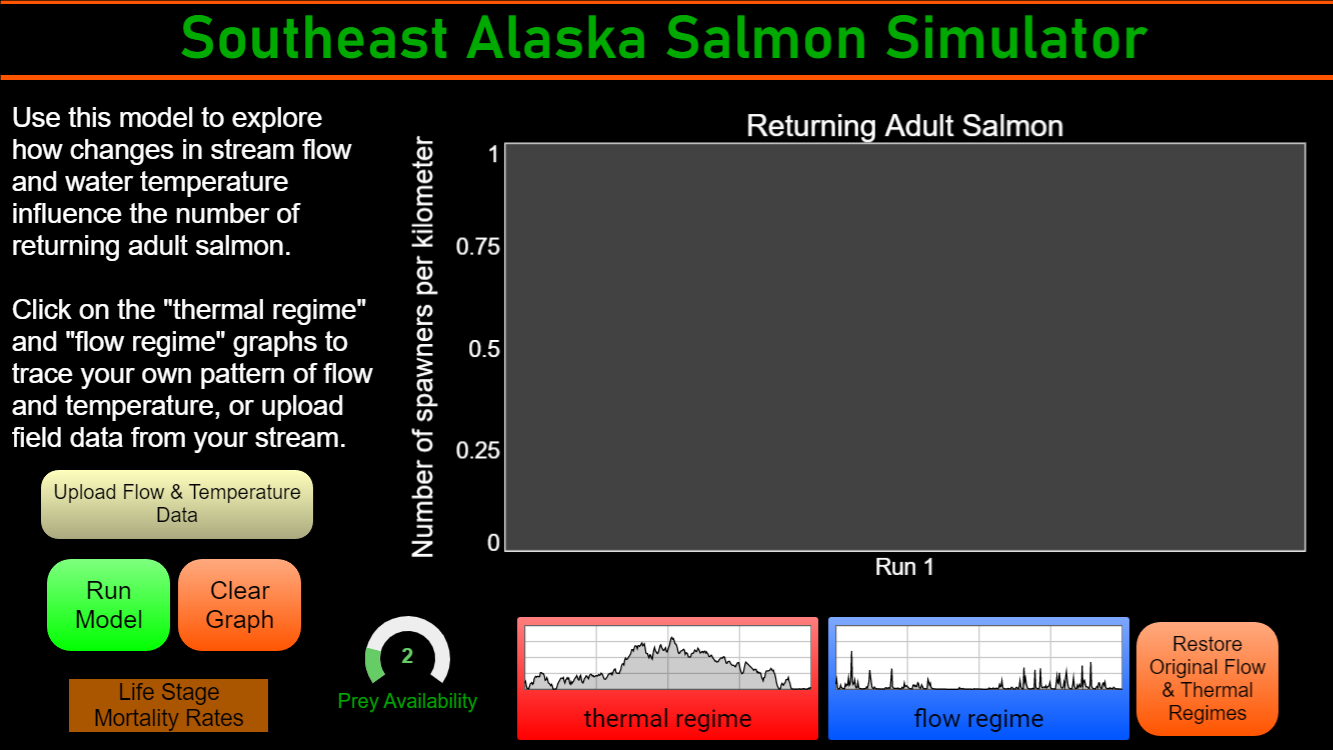
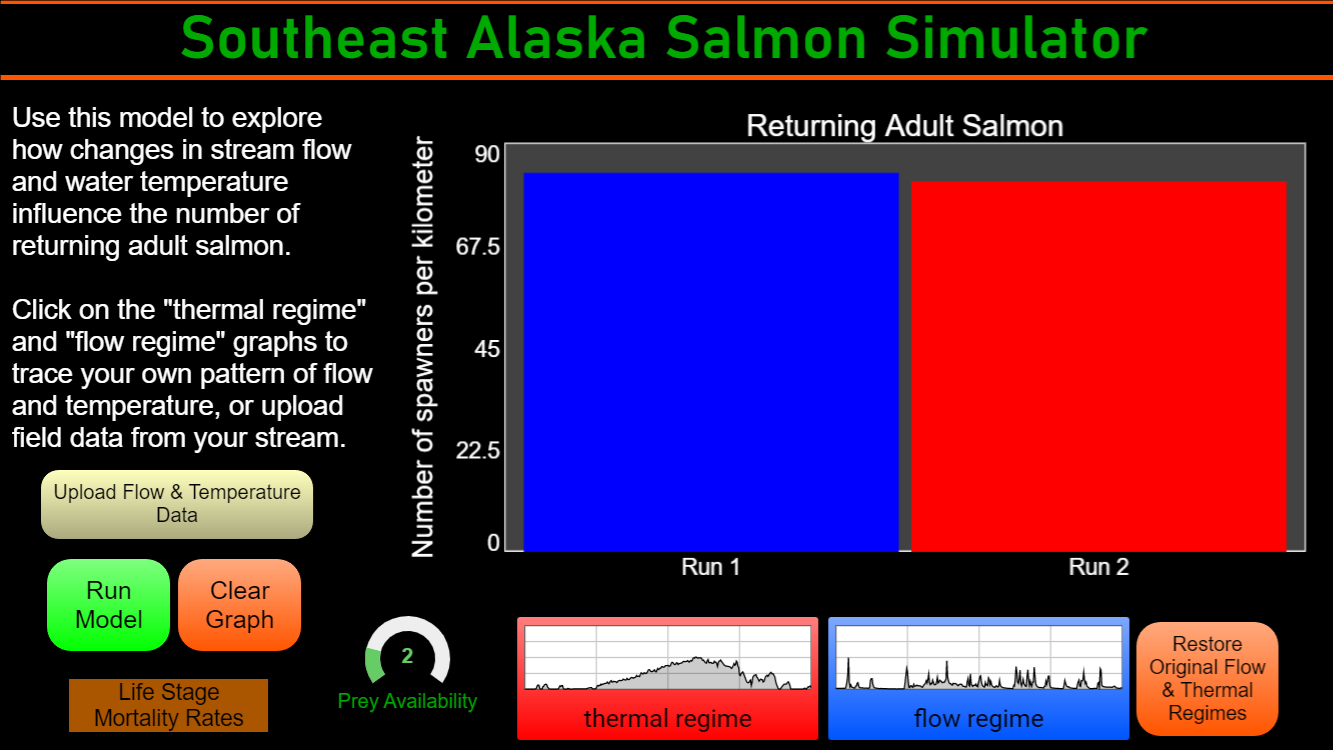
Salmon Life Cycle Simulator
sim
⋮ 1831 runs
Pacific salmon
life cycle modeling
water temperature
stream flow
Uploading a Bundle from Zip
Instead of creating bundles, categories, and assemblies one by one, you can upload a single zip file that contains all of your bundle's content. To create your zipped bundle, make a folder with your bundle's name and add subfolders with your categories' names. The folder tree should have the same structure that you want the categories to have in your bundle. Place your assembly .stmx files in the appropriate category folders, then zip your bundle folder and upload it using the Upload Bundle from Zip link above.
Assemblies, Bundles, and Categories
Assemblies are self contained models that demonstrate common ways to connect together building blocks and that can be used as parts of other models. This is analogous to using prefabricated wall and roof pieces to construct a house.
Bundles are groups of assemblies with a common use or theme. For example, a Health Care bundle might contain a variety of assemblies that aid in creating health care models. When you download assemblies from the isee Exchange™, you download an entire bundle, rather than individual assemblies.
Categories are subgroups of assemblies within a bundle. For example, a Health Care bundle might contain a Funding category for assemblies related to the management of hospital funds. All assemblies must be assigned to a category—they cannot be assigned to the root of a bundle.
Assemblies, bundles, and categories can be created and uploaded to the isee Exchange™ via the options on the Manage My Assemblies page. To learn more, visit our help pages, or take our assemblies tutorial.
Sim App (Sim)
An interface that allows users to interact with a model.
Sim apps allow users to interact with a model using buttons, sliders, knobs, tables, graphs, and storytelling. These interactions help users understand how parts of a system interact.
Interfaces are created by model authors in the Stella desktop software and can be uploaded to the isee Exchange™.
Model
A diagram that represents how elements in a system influence one another.
Models are mathematical representations of how elements in a system are connected and interact (e.g., ecosystems, organizations, supply chains). When running models on the isee Exchange™, results can be viewed in output devices like graphs and tables.
Models appear in the isee Exchange™ directory when authors upload them from the Stella® desktop software or create them with Stella Online™.
Causal Loop Diagram (CLD)
A map that represents the feedback structure of a system.

CLDs are high-level maps that represents the feedback structure of a system and easily communicate the essence of a model. They appear in the isee Exchange™ when authors upload them from the Stella desktop software or create them with Stella Online™.