Featured Author

John Hayward

I am a Visiting Research Fellow in Mathematics at the University of South Wales. Before my retirement, I was a senior lecturer at the university, teaching specialist courses in system dynamics, mathematical modelling and agent-based methods. I was awarded a BSc in astrophysics, and a PhD in applied mathematics, from the University of London, and then spent my career as a lecturer in mathematics. My research is in mathematical sociology with applications to the spread of social phenomena, such as ... Read more

Welcome to the isee Exchange™!


The Exchange is a repository of content created by Stella® users around the world. Scroll down to see featured items, search for specific items in the field above, or check out some common topics:


Learn about Stella terminology:

Like what you see? Design your own simulation-based content with our free Stella Online™ software.

If you own our Stella® Architect software, you can download assemblies—self-contained models that can be used as parts of other models—right here on the Exchange. Go here to view our assembly directory, and here to learn how assemblies can speed up and improve your modeling process.


We found 40 items
Include in results:
#1

Systems In Focus: Environment

One of the greatest environmental challenges we face is how to do more with less: Less raw materials ... Read more
One of the greatest environmental challenges we face is how to do more with less: Less raw materials, less pollution, less damage to the environment. This model shows the life-cycle assessment for the aggregate products manufactured and consumed in a firm, an industry, a region, a nation, or the world. It focuses on solid waste, though it would be easy to add air or water pollution generated and energy consumed at each stage.
model3,830 downloads
Download Model
Environment Ecology Systems in Focus Renewable Resources Raw Material
6381.203
#2

Plastics Waste

Plastic pollution has become one of the most vital issues for the environment. The usage of plastic ... Read more
Plastic pollution has become one of the most vital issues for the environment. The usage of plastic has been increased rapidly because it is inexpensive and durable, thus more plastics are being generated. As a result, the huge quantity of generated plastic ends up in the landfill as they are not biodegradable. Plastics and their byproducts are littering our cities, oceans, and waterways which causes harm to humans, animals as well as plants through toxic pollutants. A huge number of plastic wastes eventually ends up in the ocean, meaning that marine animals are also at risk. Plastic takes hundreds or even thousand years to break down, so the environmental damage is longlasting. Our main policy is to decrease the plastic pollution by increasing plastic recycle rate. Plastic recycling refers to the process of recovering waste plastic and reprocessing the materials into functional and useful products. This procedure is known as the plastic recycling process. At present around 50% plastics are thrown away only after single use. By implementing this policy, we can reuse the plastics and decrease the number of plastics that goes into the landfill. Reusing will also decrease the number of newly generated plastic. As a result of the policy, less plastics will go into the landfill, the amount of plastic sent to incineration will be reduced, more plastics will be recycled, and new plastic generation rate will be decreased. In this way plastic pollution will be decreased eventually and it will provide a positive impact on the environment.
model422 downloads
Download Model
Environment Technology Education
942.2233
#3

Supply Chain 4.0 Framework

### Key Variables for Visualization of Relationships in Supply Chain 4.0 using CLDs #### Introduc ... Read more
### Key Variables for Visualization of Relationships in Supply Chain 4.0 using CLDs #### Introduction Causal Loop Diagrams (CLDs) are valuable tools for visualizing the cause-and-effect relationships between different elements of the supply chain. Identifying the key variables involved in these relationships is essential for understanding and managing the complexities of Supply Chain 4.0. Below are the key variables that should be considered for creating effective CLDs in the context of the food industry supply chain. #### Key Variables 1. **Supply Chain Visibility** - Real-time data availability - Monitoring and tracking systems 2. **Inventory Levels** - Raw materials inventory - Work-in-progress (WIP) inventory - Finished goods inventory 3. **Demand Forecasting** - Accuracy of demand predictions - Variability in consumer demand 4. **Production Efficiency** - Production throughput - Equipment uptime and downtime - Automation levels 5. **Quality Control** - Defect rates - Inspection and testing frequency - Quality assurance processes 6. **Transportation and Logistics** - Transportation times - Fleet utilization rates - Route optimization 7. **Supplier Reliability** - On-time delivery rates - Supplier lead times - Supplier quality performance 8. **Customer Satisfaction** - Order fulfillment rates - Customer feedback and complaints - Product return rates 9. **Risk Management** - Identification of potential risks - Mitigation strategies in place - Risk monitoring and reporting 10. **Cybersecurity Measures** - Incidence of cyber-attacks - Effectiveness of security protocols - Data breach recovery times 11. **Data Integrity** - Accuracy of sensor data - Data validation processes - Error rates in data transmission 12. **Operational Costs** - Production costs - Transportation and logistics costs - Inventory holding costs 13. **Sustainability Practices** - Waste reduction rates - Energy consumption levels - Use of sustainable materials 14. **Compliance with Regulations** - Adherence to food safety standards - Compliance with environmental regulations - Implementation of regulatory changes 15. **Technology Integration** - Deployment of IoT and IoRT devices - Integration with existing systems - Technology adoption rates 16. **System Flexibility and Adaptability** - Ability to respond to demand changes - Flexibility in production processes - Scalability of supply chain operations #### Example CLD Relationships - **Inventory Levels and Production Efficiency**: - Higher inventory levels of raw materials can lead to increased production efficiency due to reduced delays in the supply chain. - However, excessive inventory can increase holding costs, affecting overall operational costs. - **Demand Forecasting and Customer Satisfaction**: - Accurate demand forecasting improves order fulfillment rates, enhancing customer satisfaction. - Inaccurate forecasts can lead to stockouts or overstock situations, negatively impacting customer satisfaction. - **Transportation and Supplier Reliability**: - Reliable suppliers ensure timely delivery of raw materials, reducing transportation times and improving overall logistics efficiency. - Delays in transportation can disrupt production schedules and lead to increased operational costs. - **Quality Control and Customer Satisfaction**: - Stringent quality control processes reduce defect rates and product returns, leading to higher customer satisfaction. - Poor quality control can result in increased defects, affecting brand reputation and customer trust. - **Cybersecurity Measures and Data Integrity**: - Robust cybersecurity measures protect data integrity, ensuring accurate and reliable information for decision-making. - Data breaches can compromise data integrity, leading to poor decisions and potential disruptions in the supply chain. - **Operational Costs and Sustainability Practices**: - Implementing sustainability practices such as waste reduction can lower operational costs in the long term. - Initial investments in sustainable technologies may increase costs but lead to long-term savings and compliance with regulations. - **Technology Integration and System Flexibility**: - Effective integration of IoT and IoRT devices enhances system flexibility and adaptability to changing conditions. - Poor integration can create bottlenecks and reduce the overall efficiency of the supply chain. #### Conclusion By identifying and understanding these key variables, supply chain managers can use CLDs to visualize the complex interactions within their operations. This approach helps in predicting potential outcomes, identifying leverage points for intervention, and developing strategies to enhance trustworthiness and resilience in Supply Chain 4.0.
model74 downloads
Download Model
A Framework for Trustworthiness and Resilience in Supply Chain 4.0
477.764
#4

Fast Fashion

by Navjot
Public Health Problem Analysis Fast Fashion as a Public Health Problem Fast fashion, defined as ... Read more
Public Health Problem Analysis Fast Fashion as a Public Health Problem Fast fashion, defined as the rapid production of inexpensive clothing to meet current trends, poses significant public health challenges. This model emphasizes affordability and accessibility, but it conceals severe environmental and social harms, making it a pressing public health issue. Definition of the Problem Fast fashion's negative impacts stem from its resource-intensive production processes, unsustainable consumption patterns, and the disposal of textiles. Textile production often involves water-intensive cotton farming and the use of untreated dyes, which contribute to environmental pollution. Workers in textile factories, particularly in low- and middle-income countries (LMICs), face unsafe working conditions and low wages, creating global environmental justice concerns (Biological Diversity, n.d.). Magnitude of the Problem The global textile industry has seen a dramatic increase in production. For instance, the per capita fiber production rose from 7.6 in 1995 to 13.8 kilograms in 2018, even as the global population increased from 5.7 billion to 7.6 billion during the same period (Nature, 2022). Fast fashion has led to the production of over 100 billion items of clothing annually, kilograms doubling the output compared to pre-2000 levels (NIST, 2021). Furthermore, clothing is worn, on average, only seven times before being discarded (NIST, 2021). These behaviors contribute to the estimated 60 million tons of clothing purchased yearly, a number projected to rise to 100 million tons by 2030 (EPA, 2021). Population(s) of Focus LMICs are disproportionately affected by the public health impacts of fast fashion. Textile workers and residents near factories are at risk of exposure to untreated dyes and chemicals. Additionally, these countries often receive large quantities of second-hand clothing, much of which cannot be recycled and contributes to environmental degradation (EPA, 2021). The lack of robust environmental regulations and labor protections exacerbates these issues (Biological Diversity, n.d.). Consequences at the Population Level Fast fashion contributes to environmental degradation, including water pollution and increased greenhouse gas emissions. The production of synthetic fibers, such as polyester and nylon, relies on fossil fuels, adding to climate change. Socially, workers face health risks from exposure to toxic chemicals and unsafe working environments. At the community level, discarded textiles in LMICs overwhelm local waste management systems, creating public health hazards (EPA, 2021; NIST, 2021). Costs to Society The financial burden of managing textile waste in the United States alone exceeded $4 billion in 2020. This figure includes collection, landfilling, and incineration costs, which are expected to increase as landfill capacities decrease and transportation costs rise (EPA, 2021). Globally, the health costs associated with exposure to pollutants and unsafe working conditions add to the societal toll. Conclusion Fast fashion exemplifies a multifaceted public health issue that requires coordinated efforts from policymakers, industry leaders, and consumers. Strategies such as implementing circular economy models, enforcing environmental regulations, and promoting sustainable consumption are crucial to mitigating its impacts. Public health professionals must advocate for sustainable practices to address the environmental and social inequities perpetuated by this industry. Problem statement Fast fashion exacerbates environmental degradation, perpetuates occupational hazards in low-regulation settings, and strains waste management systems, constituting a significant global public health challenge. https://www.biologicaldiversity.org/programs/population_and_sustainability/sustainability/fast_fashion# https://pubmed.ncbi.nlm.nih.gov/30591057/ https://nvlpubs.nist.gov/nistpubs/SpecialPublications/NIST.SP.1500-207.pdf https://www.nature.com/articles/d41586-022-02914-2 https://www.epa.gov/facts-and-figures-about-materials-waste-and-recycling/textiles-material-specific-data https://www.epa.gov/facts-and-figures-about-materials-waste-and-recycling/methodology-epas-facts-and-figures-materials 
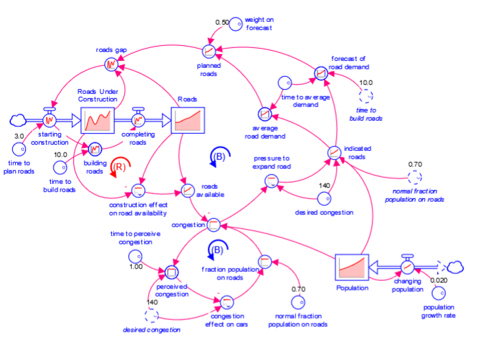
https://www.clearbluesea.org/wp-content/uploads/2021/06/Fast-Fashion-White-Paper-2021-09-15.pdf this is my paper and for this paper i need stock flow diagram for which my specifications are at least one stock at least 3 inflows at least 3 outflows at least 1 feedback loop appropriate nomenclature
model76 downloads
Download Model
Environment
384.21735
#5

example model

This model was copied from isee systems: One of the greatest environmental challenges we face is ho ... Read more
This model was copied from isee systems: One of the greatest environmental challenges we face is how to do more with less: Less raw materials, less pollution, less damage to the environment. This model shows the life-cycle assessment for the aggregate products manufactured and consumed in a firm, an industry, a region, a nation, or the world. It focuses on solid waste, though it would be easy to add air or water pollution generated and energy consumed at each stage.
model221 downloads
Download Model
Environment Ecology Renewable Resources Raw Material
343.88434
#6

Bills Copy of the LCA

This model was copied from isee systems: One of the greatest environmental challenges we face is ho ... Read more
This model was copied from isee systems: One of the greatest environmental challenges we face is how to do more with less: Less raw materials, less pollution, less damage to the environment. This model shows the life-cycle assessment for the aggregate products manufactured and consumed in a firm, an industry, a region, a nation, or the world. It focuses on solid waste, though it would be easy to add air or water pollution generated and energy consumed at each stage.
model201 downloads
Download Model
Environment Ecology Renewable Resources Raw Material
315.931
#7

danieltj

This model was copied from isee systems: One of the greatest environmental challenges we face is ho ... Read more
This model was copied from isee systems: One of the greatest environmental challenges we face is how to do more with less: Less raw materials, less pollution, less damage to the environment. This model shows the life-cycle assessment for the aggregate products manufactured and consumed in a firm, an industry, a region, a nation, or the world. It focuses on solid waste, though it would be easy to add air or water pollution generated and energy consumed at each stage.
model163 downloads
Download Model
Environment Ecology Renewable Resources Raw Material
262.81967
#8

wwef

Key Components of the System Water: Desalinated water (primary source in Qatar). Groundwater ... Read more
Key Components of the System Water: Desalinated water (primary source in Qatar). Groundwater and treated wastewater. Water demand for agriculture, industry, and domestic use. Energy: Energy production (primarily from fossil fuels in Qatar). Energy used for water desalination, food production, and waste management. Food: Food production (limited due to arid climate, heavily reliant on imports). Food consumption and waste generation. Waste: Organic and inorganic waste from food, water, and energy sectors. Waste treatment and recycling (e.g., composting, energy recovery). Interdependencies and Feedback Loops Water-Energy Nexus: Desalination requires significant energy input. Energy production (e.g., power plants) requires water for cooling. Loop: Increased water demand → Increased energy demand → Increased water demand for energy production. Energy-Food Nexus: Energy is required for food production (irrigation, processing, transportation). Food waste can be converted into energy (e.g., biogas). Loop: Increased food demand → Increased energy demand → Increased food waste → Potential energy recovery. Food-Water Nexus: Agriculture requires water for irrigation. Food waste contributes to water pollution if not managed properly. Loop: Increased food production → Increased water demand → Increased food waste → Increased water pollution. Waste-Energy-Water Nexus: Waste treatment (e.g., wastewater treatment) requires energy. Treated wastewater can be reused for irrigation or industrial purposes. Loop: Increased waste generation → Increased energy demand for treatment → Increased water recovery → Reduced freshwater demand. Stock-Flow Diagram Structure Stocks: Water reserves (desalinated, groundwater, treated wastewater). Energy reserves (fossil fuels, renewable energy). Food stocks (imported and locally produced). Waste accumulation (organic, inorganic). Flows: Water flow: Desalination, groundwater extraction, wastewater treatment. Energy flow: Energy production, energy consumption for desalination, food production, and waste management. Food flow: Food production, consumption, and waste generation. Waste flow: Waste generation, treatment, and recycling. Feedback Loops: Reinforcing loops: E.g., increased water demand leads to increased energy demand, which further increases water demand. Balancing loops: E.g., waste-to-energy processes reduce waste accumulation and provide energy. Example Loop: Water-Energy-Food-Waste Water Demand Increases: Due to population growth or agricultural needs. Energy Demand Increases: More energy is needed for desalination and water distribution. Food Production Increases: More water and energy are used for agriculture. Waste Generation Increases: Food waste and wastewater increase. Waste Management Requires Energy: Energy is used to treat waste and recover resources. Recycled Water and Energy: Treated wastewater is reused, and waste-to-energy processes provide additional energy.
model72 downloads
Download Model
Environment
256.688
#9

Food waste in Food supply chains

Understanding causes of food waste in food systems.
model212 downloads
Download Model
Environment Business Technology Economics
185.94867
#10

Environment

This model was copied from isee systems: One of the greatest environmental challenges we face is ho ... Read more
This model was copied from isee systems: One of the greatest environmental challenges we face is how to do more with less: Less raw materials, less pollution, less damage to the environment. This model shows the life-cycle assessment for the aggregate products manufactured and consumed in a firm, an industry, a region, a nation, or the world. It focuses on solid waste, though it would be easy to add air or water pollution generated and energy consumed at each stage.
model96 downloads
Download Model
Environment Ecology Renewable Resources Raw Material
169.176
#11

EcOT4aquafeed model

The Economic opportunities and trade-offs for quafeed (EcOT4aquafeed) model is a system dynamics mod ... Read more
The Economic opportunities and trade-offs for quafeed (EcOT4aquafeed) model is a system dynamics model that is developed on the principle of circular economy. The model comprises of four interacting modules: - (i) Vegetable and fruit waste module; (ii) Feed production module; (iii) Fish (barramundi) production module; and (iv) Economic module.
sim151 runs
Environment Business Technology Economics
165.54567
#12

food waste

model178 downloads
Download Model
Environment Technology Science Ecology
149.34666
#13

Sustainable Zero Waste Tyre Life Cycle

by Aldrich
About 5 million tyres are disposed of every year in New Zealand and 70 per cent end up in a landfill ... Read more
About 5 million tyres are disposed of every year in New Zealand and 70 per cent end up in a landfill. These tyres occupy a considerable amount of space. Often unaccounted for after disposal, tyre dumps eventually attract rats and other contaminants which may disrupt nearby environmental ecosystems in a way such as soil pollution. The standard is such that there is a difficulty with regards to recycling tyres due to the lack of an efficient system, tools, mechanics or even a commercial product that makes use of used tyres. As a result, tyres are quickly forgotten after disposed. This is an important problem in New Zealand with disastrous longer term environmental effects if not dealt with in the next few years.
sim131 runs
sustainable zero waste tyres life cycle recycling
141.882
#14

Antibiotic model in Waste stabilization pond

During the wastewater treatment effluent discharge into WSP, antibiotic may undergo fate and transpo ... Read more
During the wastewater treatment effluent discharge into WSP, antibiotic may undergo fate and transport processes within WSP . These processes are photodegradation, biodegradation, hydrolysis, and sorption. Their overall contribution may result to the antibiotic attenuation at the outlet of the WSP.
model74 downloads
Download Model
Environment Technology Science Ecology Education
131.816
#15

Wastewater

model406 downloads
Download Model
Science
110.56
#16
This model was copied from isee systems: One of the greatest environmental challenges we face is ho ... Read more
This model was copied from isee systems: One of the greatest environmental challenges we face is how to do more with less: Less raw materials, less pollution, less damage to the environment. This model shows the life-cycle assessment for the aggregate products manufactured and consumed in a firm, an industry, a region, a nation, or the world. It focuses on solid waste, though it would be easy to add air or water pollution generated and energy consumed at each stage.
model40 downloads
Download Model
Environment Ecology Systems in Focus Renewable Resources Raw Material
107.90667
#17

IE2141 Waste Management Project Stock Flow

model288 downloads
Download Model
Environment Ecology
103.88
#18

plastic waste

human made pollution and its impact
diagram189 downloads
Download Model
Environment Science Ecology
101.47633
#19

Menstrual waste management

model118 downloads
Download Model
Environment Biology Science Ecology
90.91333
#20

WtE ARI

Waste to energy simulator
model71 downloads
Download Model
Environment Technology Economics Municipal Solid Waste
86.185
#21

Solid Waste

This systems model provides a clear overview of the solid waste management process. By identifying s ... Read more
This systems model provides a clear overview of the solid waste management process. By identifying stocks, flows, and converters, we can understand how waste moves through the system and where improvements can be made. Key insights include: Feedback Mechanisms: Public feedback and participation are crucial. Improving public awareness can enhance collection efficiency and reduce waste generation. Regulatory Influence: Regulations play a significant role in shaping the system's efficiency. Compliance and updates ensure the system operates within legal and environmental standards. Recycling and Composting: Effective recycling and composting can significantly reduce the amount of waste sent to landfills. This reduces environmental impact and promotes sustainability. Collection Efficiency: Optimizing the collection process, including route planning and schedules, can reduce operational costs and improve service quality.
model46 downloads
Download Model
Environment Education
85.290665
#22

Landfill Design

This code determines the landfill capacity requirements for a municipal solid waste landfill.
model156 downloads
Download Model
Environment Education
83.124
#23

Cattle waste, feed, and worm loop

Importance of deworming in cattle
diagram151 downloads
Download Model
Environment Science Ecology
80.59967
#24

pwm

by qudsia
plastic waste management in Nordics
model82 downloads
Download Model
Environment Technology Science Economics
79.206665
#25

Solid Waste Management

by Sheryl
model55 downloads
Download Model
Environment Technology Science Economics Ecology
78.3
#26

Waste water

model267 downloads
Download Model
69.42
#27

impact of tourism on the eco system of the Himalayas

focus is on Waste management in Himachal Pradesh and Uttarakhand
model70 downloads
Download Model
Environment Ecology Pollution and tourism
68.54667
#28

URBAN SUSTANABLITY

The Causal Loop Diagram (CLD) developed for the SUSTAIN model is composed by different variables, t ... Read more
The Causal Loop Diagram (CLD) developed for the SUSTAIN model is composed by different variables, that represent areas of interest in a general modern urban system at the same time giving emphasis to management issues related to more specific areas/sectors of an urban environment. Stated differently, the model includes both sectors devoted to specific areas of a modern urban environment (e.g., environment, transport, urban planning, waste and water management) and a core sector where “common” variables (e.g., GDP and population) are included and are affected by the decisions taken in other areas of the model. As the CLD (and the subsequently developed Stock and Flow Diagram) was the basis for the development of the rules and elements of the boardgame (which is one of the main outcomes of the SUSTAIN project), the core of the model revolves around one of the most important parameters for deciding who will win the game, i.e. the Attractiveness of the city. This variable is the synthesis of multiple variables that belong to many aspects of the urban system, defining the “wellbeing” of the population who lives in it. The most important effect due to variations in the Attractiveness of the city is a variation of the number of people who live there; this generates many impacts on different urban levels, triggering in turn a certain number of feedback loops. In fact, most of the feedback loops we identified “pass” through the Population variable. It is kind of natural that this happens as, in the end, urban systems exist because of its inhabitants, indeed. Analysing the CLD (see Fig. 4.4), the most important feedback loops were identified and then divided into three main groups. The first group is composed of loops belonging to the “core” of the model, that is constituted by the relation between population, GDP and Industries and Services (Fig. 4.5). The first two reinforcing feedback loops (R1 and R2) trigger when a variation in the Attractiveness of the city causes an increase in Population, which generally has a positive effect on the GDP: the more the GDP, the more the development of industries and services. This generates a twofold positive effect on attractiveness: on one hand, there is the availability of more services and developed industries; on the other hand, more services and industries lead to more jobs for inhabitants. The former phenomenon is limited by a balancing feedback loop (B1), which depicts the saturation of jobs in the city. Finally, GDP and Industries and Services are tied together by a simple reinforcing feedback loop (R3). The second group is composed by loops which belong to the “environmental” part of the model. Water, waste and transport have direct impacts on the total pollution and, in turn, on the Attractiveness of the city. As opposed to the reinforcing loops previously described, there are two balancing loops (B2 and B3) that tend to stabilize the Attractiveness of the city through the possible increase in population, which in turn causes an increase in waste generation and water consumption, with consequences on pollution and water shortage. Another reinforcing feedback (R4) describes how traffic congestion influences the usage of public transport and, in turn, how it impacts pollution. This loop is balanced by two loops (B4 and B5): on one hand, the usage of public transport naturally reduces the problem of traffic congestion; on the other hand, external policies could increase the roads’ capacity and length addressing the same problem The third and last group of main feedback loops concerns the topic of “land availability”. Cities cannot indeed grow indefinitely; above all, it is important to dedicate some space for green areas and parking lots, which complete the viability of the city. The loops belonging to the third group are balancing loops which limit
diagram28 downloads
Download Model
Environment Technology Health
65.461334
#29

Solid Waste System Model

This systems model provides a clear overview of the solid waste management process. By identifying s ... Read more
This systems model provides a clear overview of the solid waste management process. By identifying stocks, flows, and converters, we can understand how waste moves through the system and where improvements can be made. Key insights include: Feedback Mechanisms: Public feedback and participation are crucial. Improving public awareness can enhance collection efficiency and reduce waste generation. Regulatory Influence: Regulations play a significant role in shaping the system's efficiency. Compliance and updates ensure the system operates within legal and environmental standards. Recycling and Composting: Effective recycling and composting can significantly reduce the amount of waste sent to landfills. This reduces environmental impact and promotes sustainability. Collection Efficiency: Optimizing the collection process, including route planning and schedules, can reduce operational costs and improve service quality.
model36 downloads
Download Model
Environment
60.584
#30

Shower heat recovery

Recovering heat from wastewater
model76 downloads
Download Model
Environment Technology Education
57.732666
#31

Plastic waste

diagram236 downloads
Download Model
Environment
56.16
#32

Wastewater

How Wastewater can be utilized with Algae to produce oxygen
model168 downloads
Download Model
Environment
55.942
#33

Wastewater

by Claudia
model194 downloads
Download Model
Science
55.44
#34

Water Supply and WasteWater Management

by Nii
The sustainable use and protection of clean water systems, to ensure water security for the people ... Read more
The sustainable use and protection of clean water systems, to ensure water security for the people of Ghana diseases, droughts and floods
diagram86 downloads
Download Model
Environment Technology
47.084
#35

Waste Management Model

Develop a system dynamics model to understand how effective waste management impacts human health th ... Read more
Develop a system dynamics model to understand how effective waste management impacts human health through reduced exposure to unmanaged waste and pollution
model68 downloads
Download Model
Environment Health
45.503334
#36

plastic waste

diagram91 downloads
Download Model
Environment Science Ecology
45.02667
#37

IE2141 Group 2-D (Semakau’s Lifespan and Waste Management in Singapore)

IE2141 Group 2-D
sim191 runs, 16 downloads
Download Model
44.22
#38

foodwaste

menggambarkan jumlah foodwaste yang di hasilkan perhari
model104 downloads
Download Model
Education rakmad
43.976665
#39

IE 2141 G10-G

by Ron Tan
Food waste generated by household
model150 downloads
Download Model
Environment
40.7
#40

climate change with food scarcity

how would the climate change affect the food scarcity and foodwaste. Show those values can affect ... Read more
how would the climate change affect the food scarcity and foodwaste. Show those values can affect the increasing/decreasing of agriculture growth and increasing/decreasing of food storage.
model113 downloads
Download Model
38.88
X

Uploading a Bundle from Zip

Instead of creating bundles, categories, and assemblies one by one, you can upload a single zip file that contains all of your bundle's content. To create your zipped bundle, make a folder with your bundle's name and add subfolders with your categories' names. The folder tree should have the same structure that you want the categories to have in your bundle. Place your assembly .stmx files in the appropriate category folders, then zip your bundle folder and upload it using the Upload Bundle from Zip link above.

Assemblies, Bundles, and Categories

Assemblies are self contained models that demonstrate common ways to connect together building blocks and that can be used as parts of other models. This is analogous to using prefabricated wall and roof pieces to construct a house.

Bundles are groups of assemblies with a common use or theme. For example, a Health Care bundle might contain a variety of assemblies that aid in creating health care models. When you download assemblies from the isee Exchange™, you download an entire bundle, rather than individual assemblies.

Categories are subgroups of assemblies within a bundle. For example, a Health Care bundle might contain a Funding category for assemblies related to the management of hospital funds. All assemblies must be assigned to a category—they cannot be assigned to the root of a bundle.

Assemblies, bundles, and categories can be created and uploaded to the isee Exchange™ via the options on the Manage My Assemblies page. To learn more, visit our help pages, or take our assemblies tutorial.

Sim App (Sim)

An interface that allows users to interact with a model.

Image of a sim

Sim apps allow users to interact with a model using buttons, sliders, knobs, tables, graphs, and storytelling. These interactions help users understand how parts of a system interact.

Interfaces are created by model authors in the Stella desktop software and can be uploaded to the isee Exchange™.

Model

A diagram that represents how elements in a system influence one another.

Image of a model

Models are mathematical representations of how elements in a system are connected and interact (e.g., ecosystems, organizations, supply chains). When running models on the isee Exchange™, results can be viewed in output devices like graphs and tables.

Models appear in the isee Exchange™ directory when authors upload them from the Stella® desktop software or create them with Stella Online™.

Causal Loop Diagram (CLD)

A map that represents the feedback structure of a system.

Image of a CLD

CLDs are high-level maps that represents the feedback structure of a system and easily communicate the essence of a model. They appear in the isee Exchange™ when authors upload them from the Stella desktop software or create them with Stella Online™.